Toukhmanuk GOLD
The Public Record  ·  Edition 2026
Armenia  ·  Republic of  ·  Mining integrity

The gold that is silver,
the reserves that never were.

In November 2016, Armenia’s State Committee of Reserves approved 2.57 million tonnes of ore at 5.00 g/t gold for Toukhmanuk. By that date the operator had held, for nearly four years, three independent findings on its own database — a 17.3× divergence on pulp re-assay, phantom intervals and a silver-for-gold transposition in the block model, and a 2.6× divergence between the operator’s laboratory and an independent laboratory on splits of the same samples. None of it reached the commission.

The one constant factor across every finding, transaction and dispute described above is Van Z. Krikorian, who at all material times served as President, CEO, Director and Legal Counsel of Global Gold Corp. — signatory on the 2011 CSA Global contract, named recipient of the April 2012 adverse findings, and the senior officer whose representations brought each successive counterparty (CRA, Linne Mining, and now Optima Management) into the project.

The database cannot support a reliable grade or economic assessment. Until independent re-verification is performed and certified by a Competent Person under JORC or NI 43-101, the 2016 figure is not a basis on which to transact.

Public notice The 2016 GKZ reserves approval is being presented to a third commercial counterparty. Two prior counterparties, advancing a combined USD 12.8 million, lost their investment.
§ 01  ·  The case, in short

A state reserves approval built on a rejected dataset

The arithmetic in the 2016 file reconciles. The problem is everything upstream of the arithmetic.

The Toukhmanuk mineral field, in Armenia’s Aragatsotn region, has been worked in one form or another since the 1980s. In November 2016, the State Committee of Reserves issued Expertise Conclusion N6, formally registering a reserves estimate prepared by Mego-Gold LLC, the Armenian subsidiary of the 
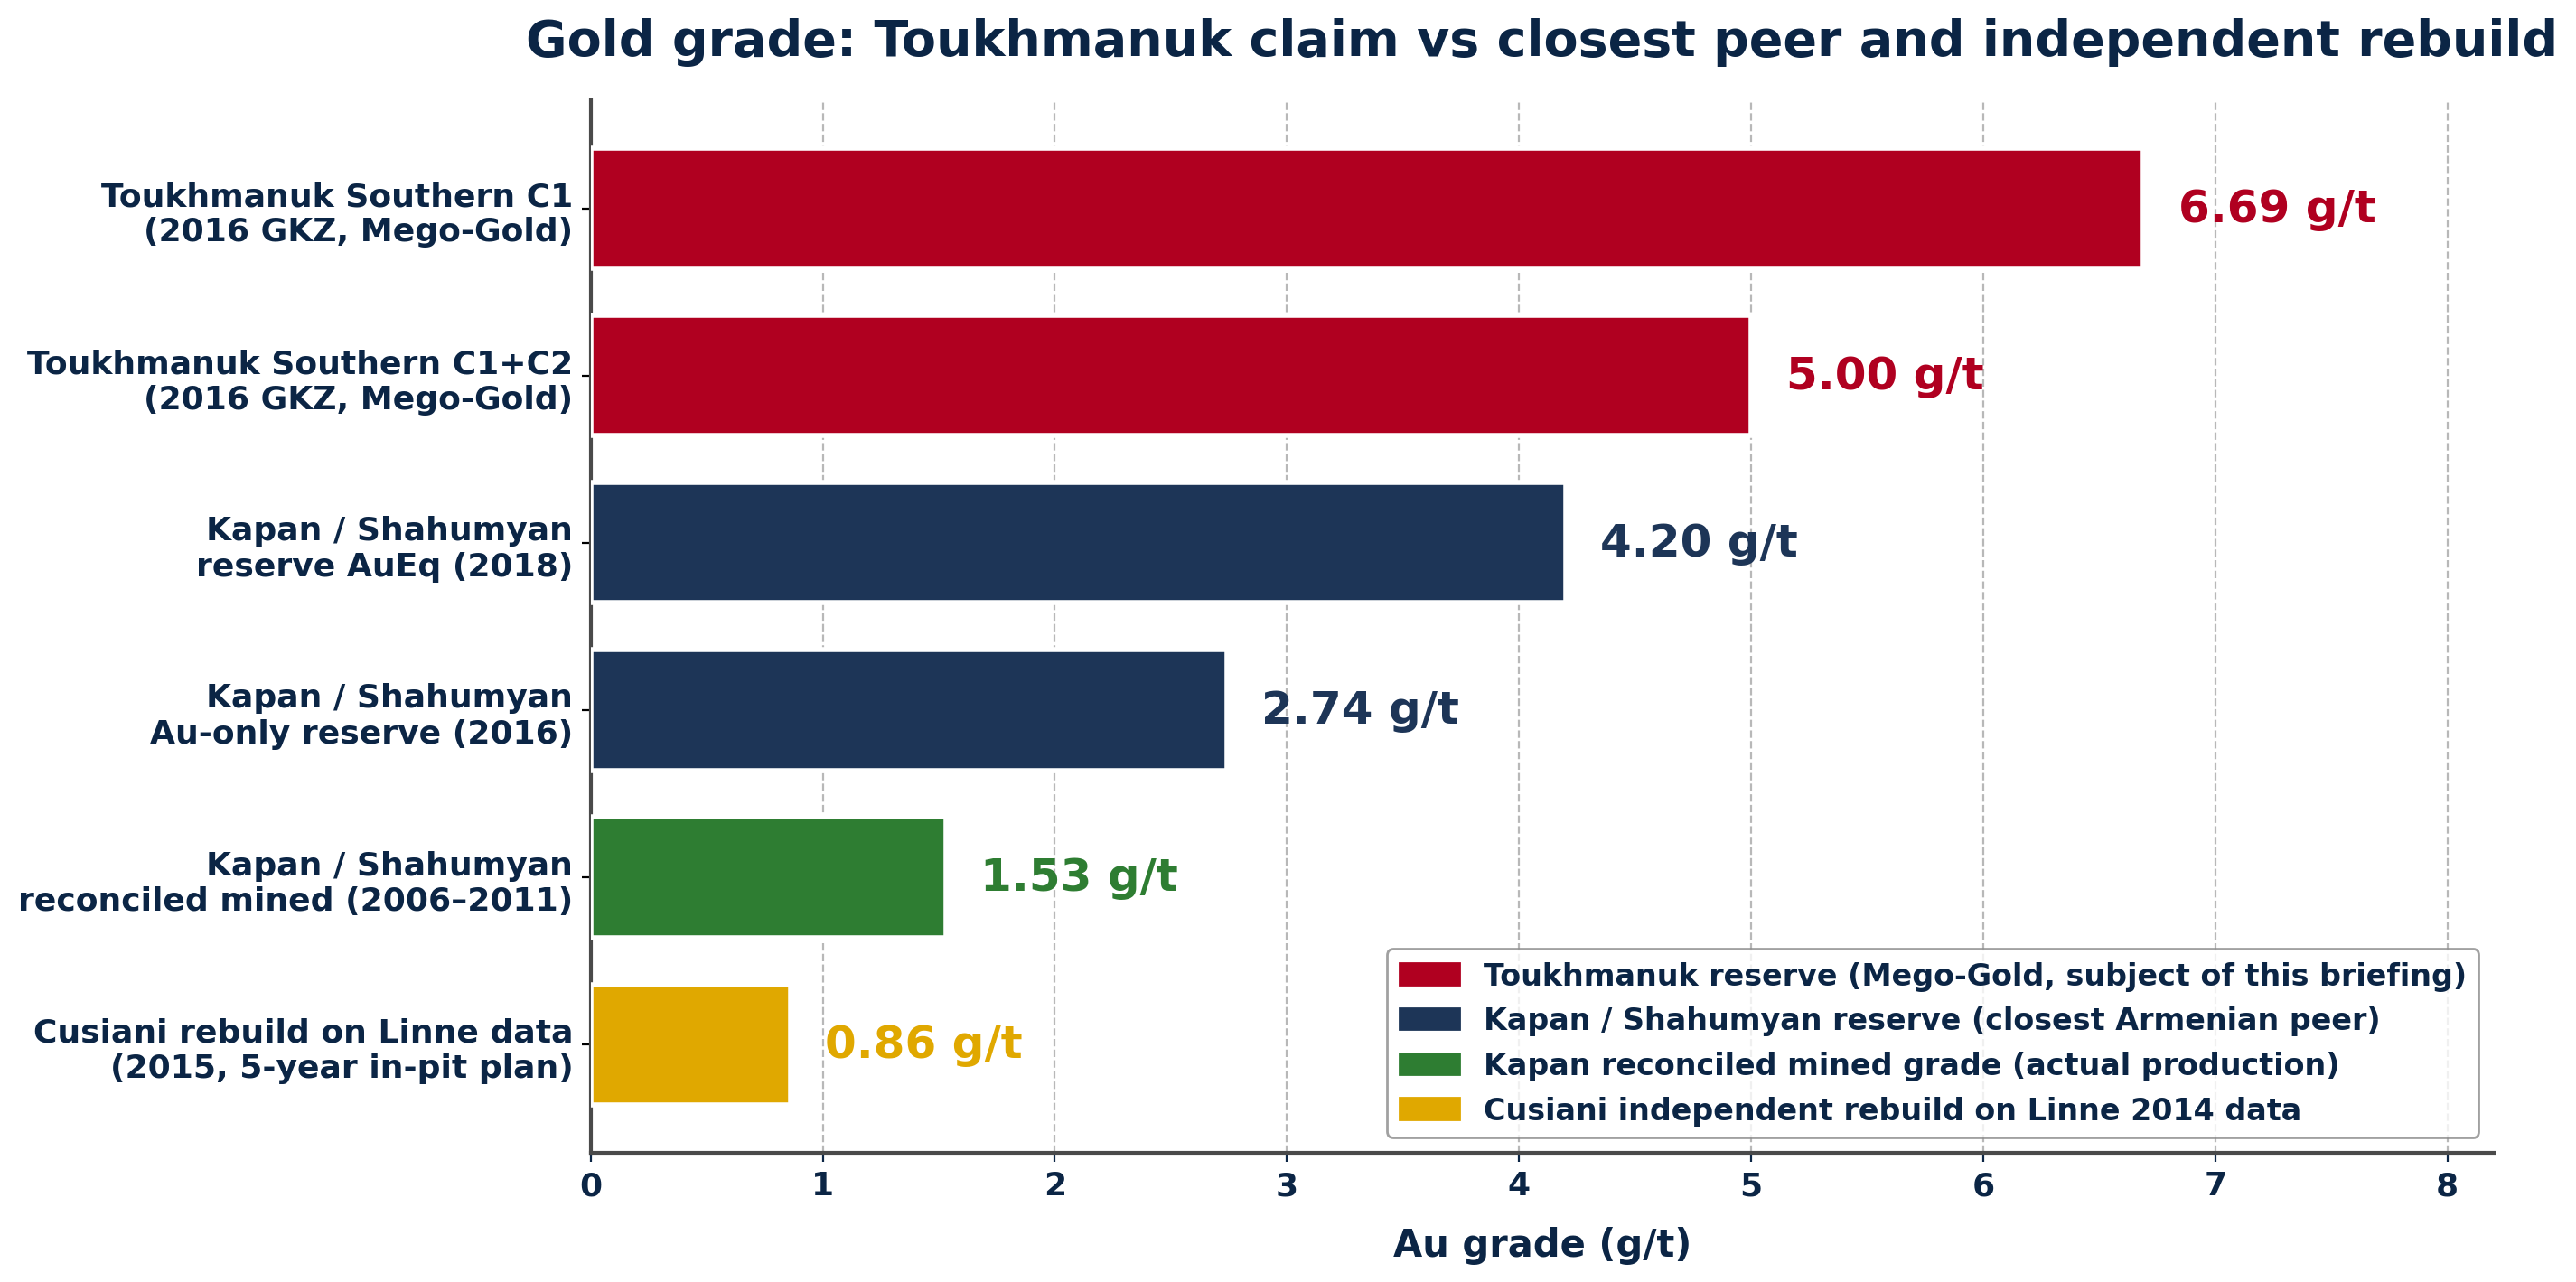
US-listed Global Gold Corp. (OTC: GBGD). The registered tonnage was 2.57 million tonnes of ore; the headline grade, 5.00 g/t gold at the Southern area; the highest-confidence category, 6.69 g/t.

Those numbers are arithmetically consistent with the block-level tables in the file. Addition is not the issue. The issue is that the sample database on which the block tables rest — the same database that earlier supported a much larger claim in the 2011 Behre Dolbear NI 43-101 technical report of 39.23 Mt at 2.1 g/t Au — 
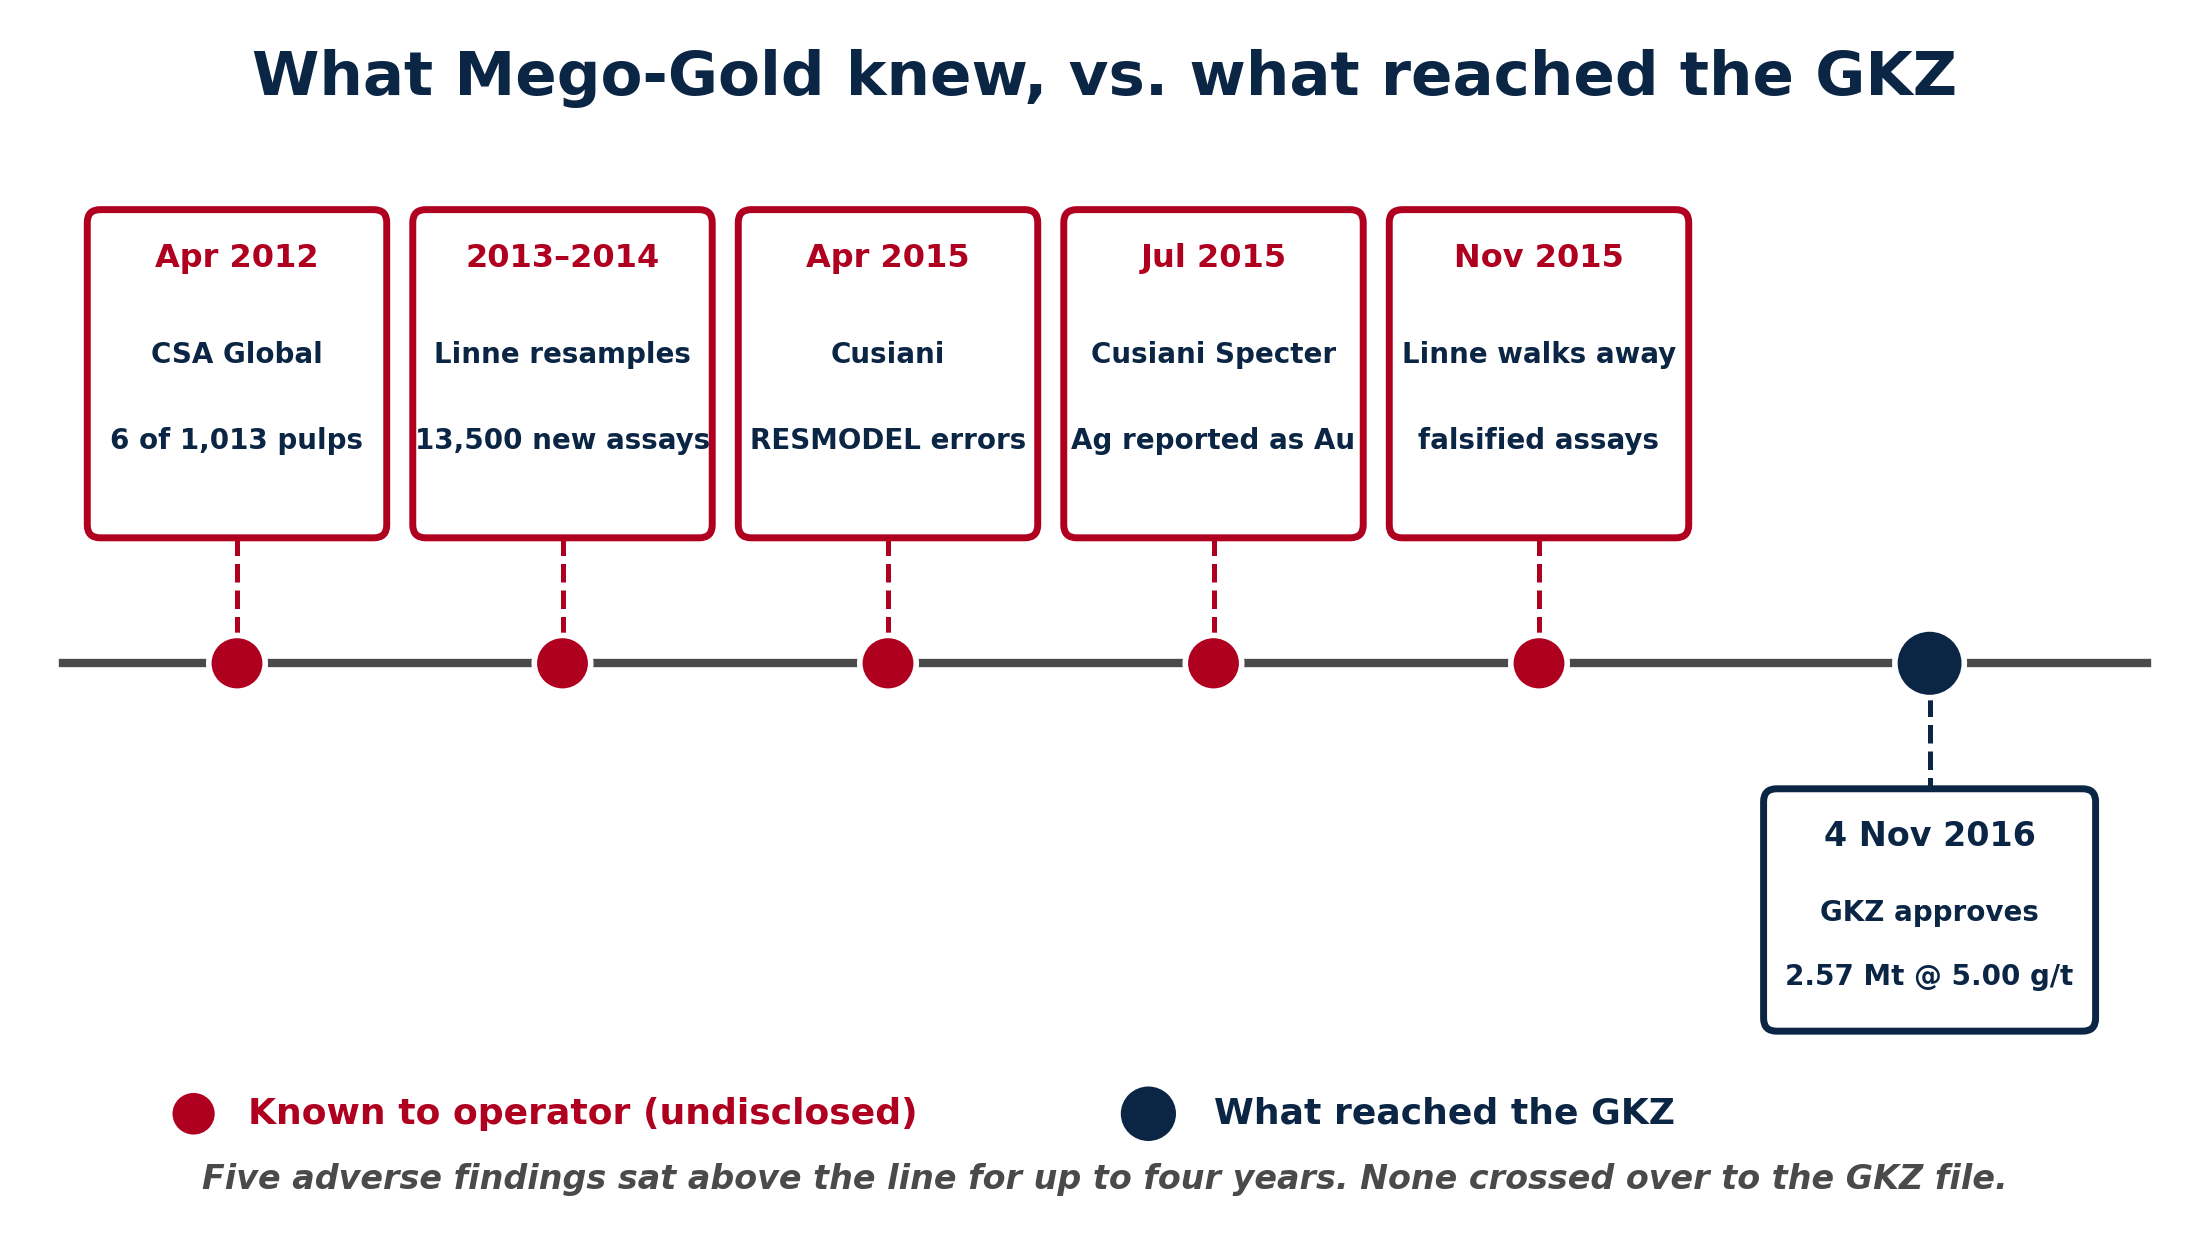
had, by April 2016, been the subject of two separate adverse independent reviews, commissioned by two different commercial counterparties, over the preceding four years. Neither review was placed before the commission.

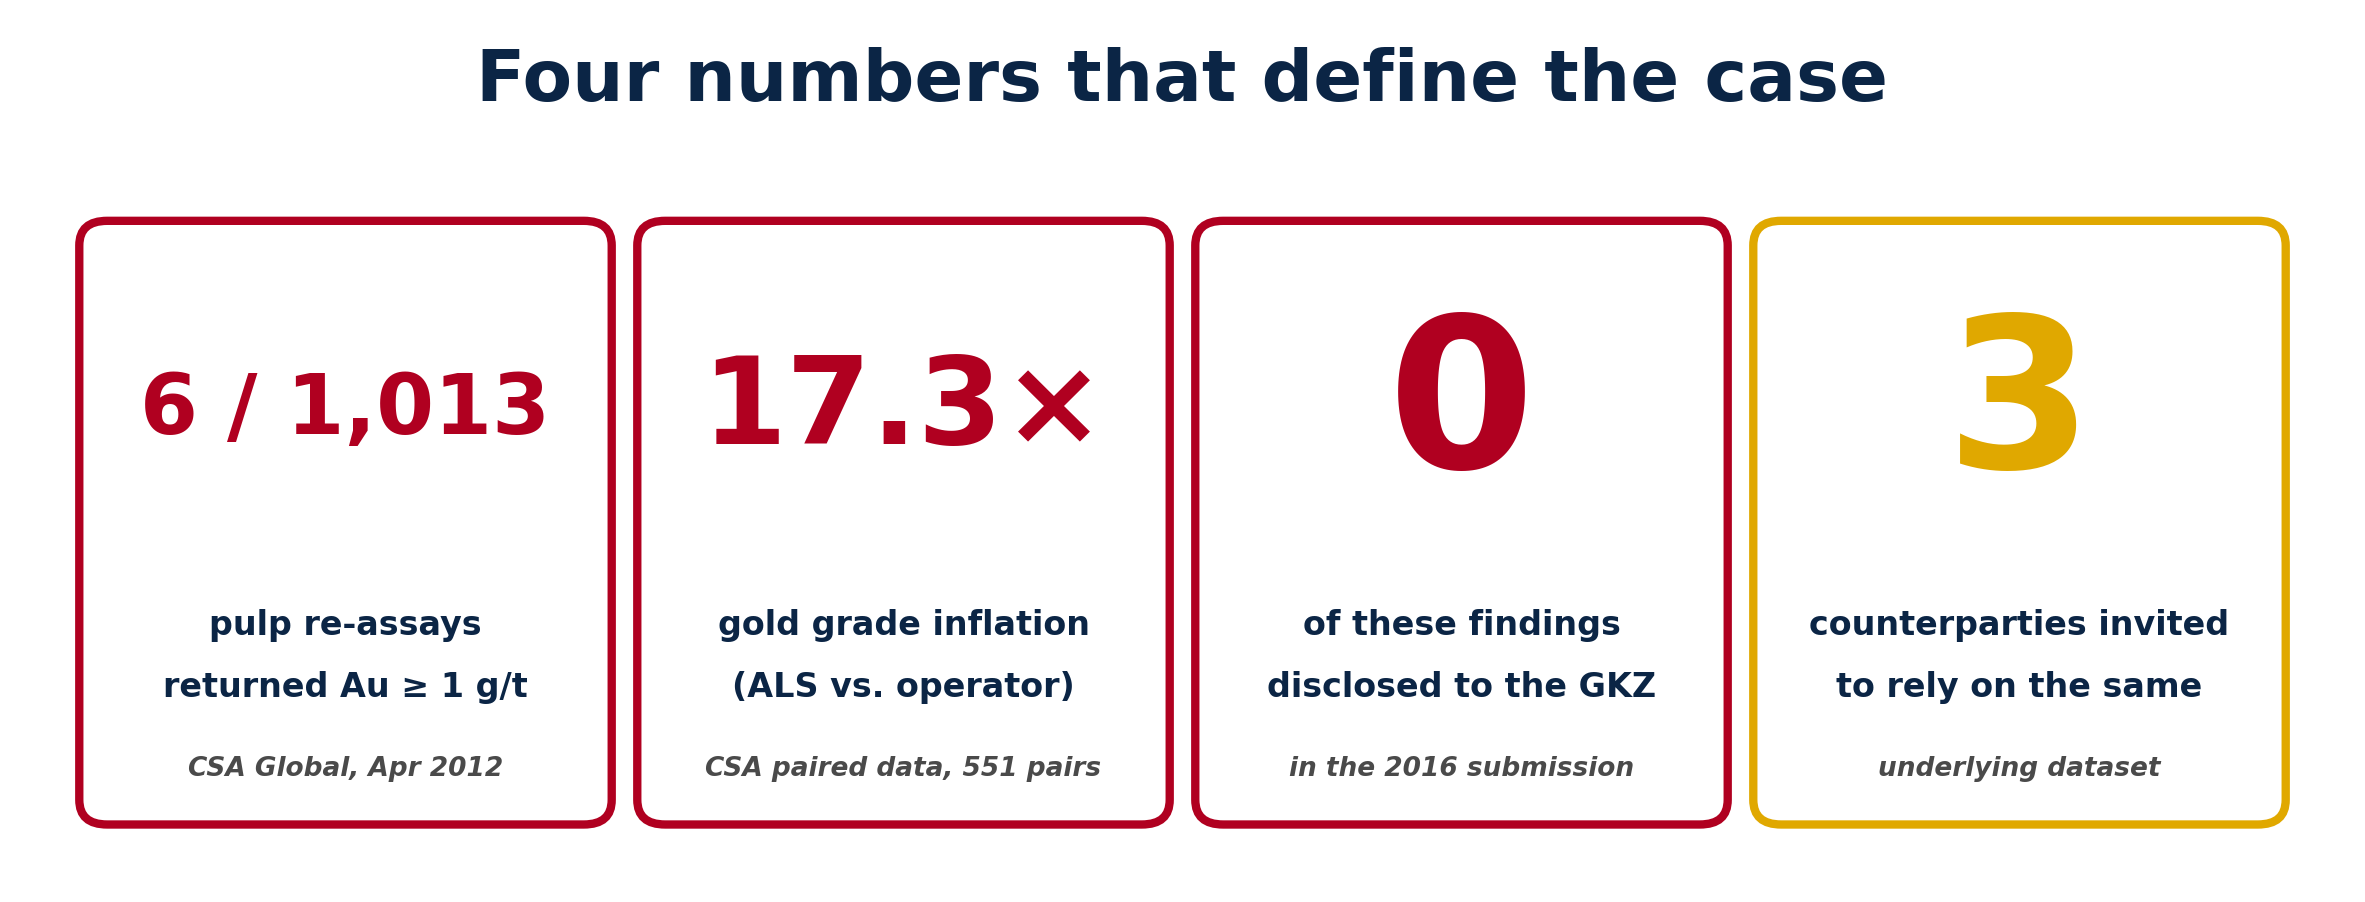
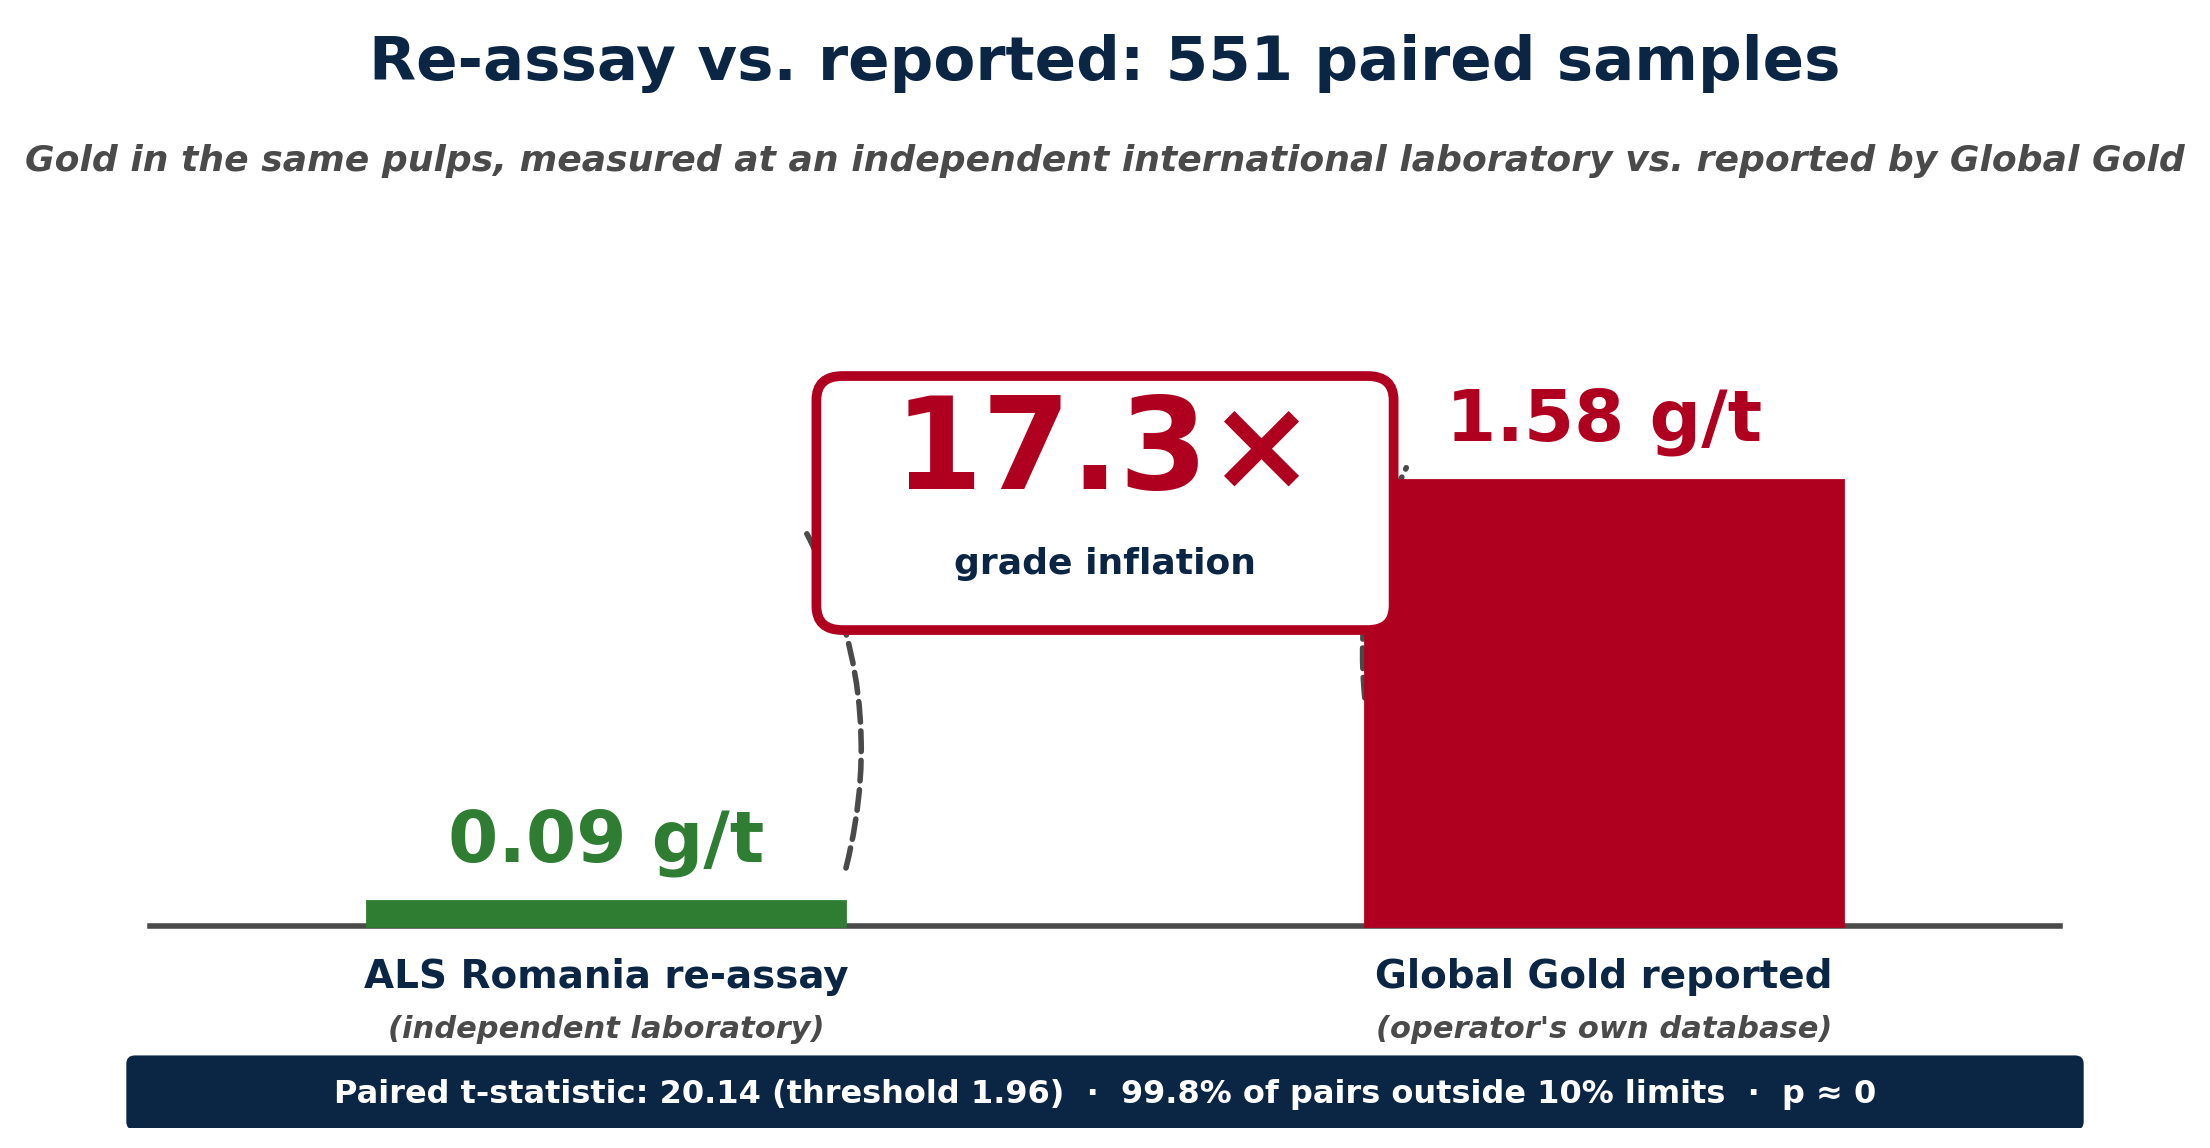
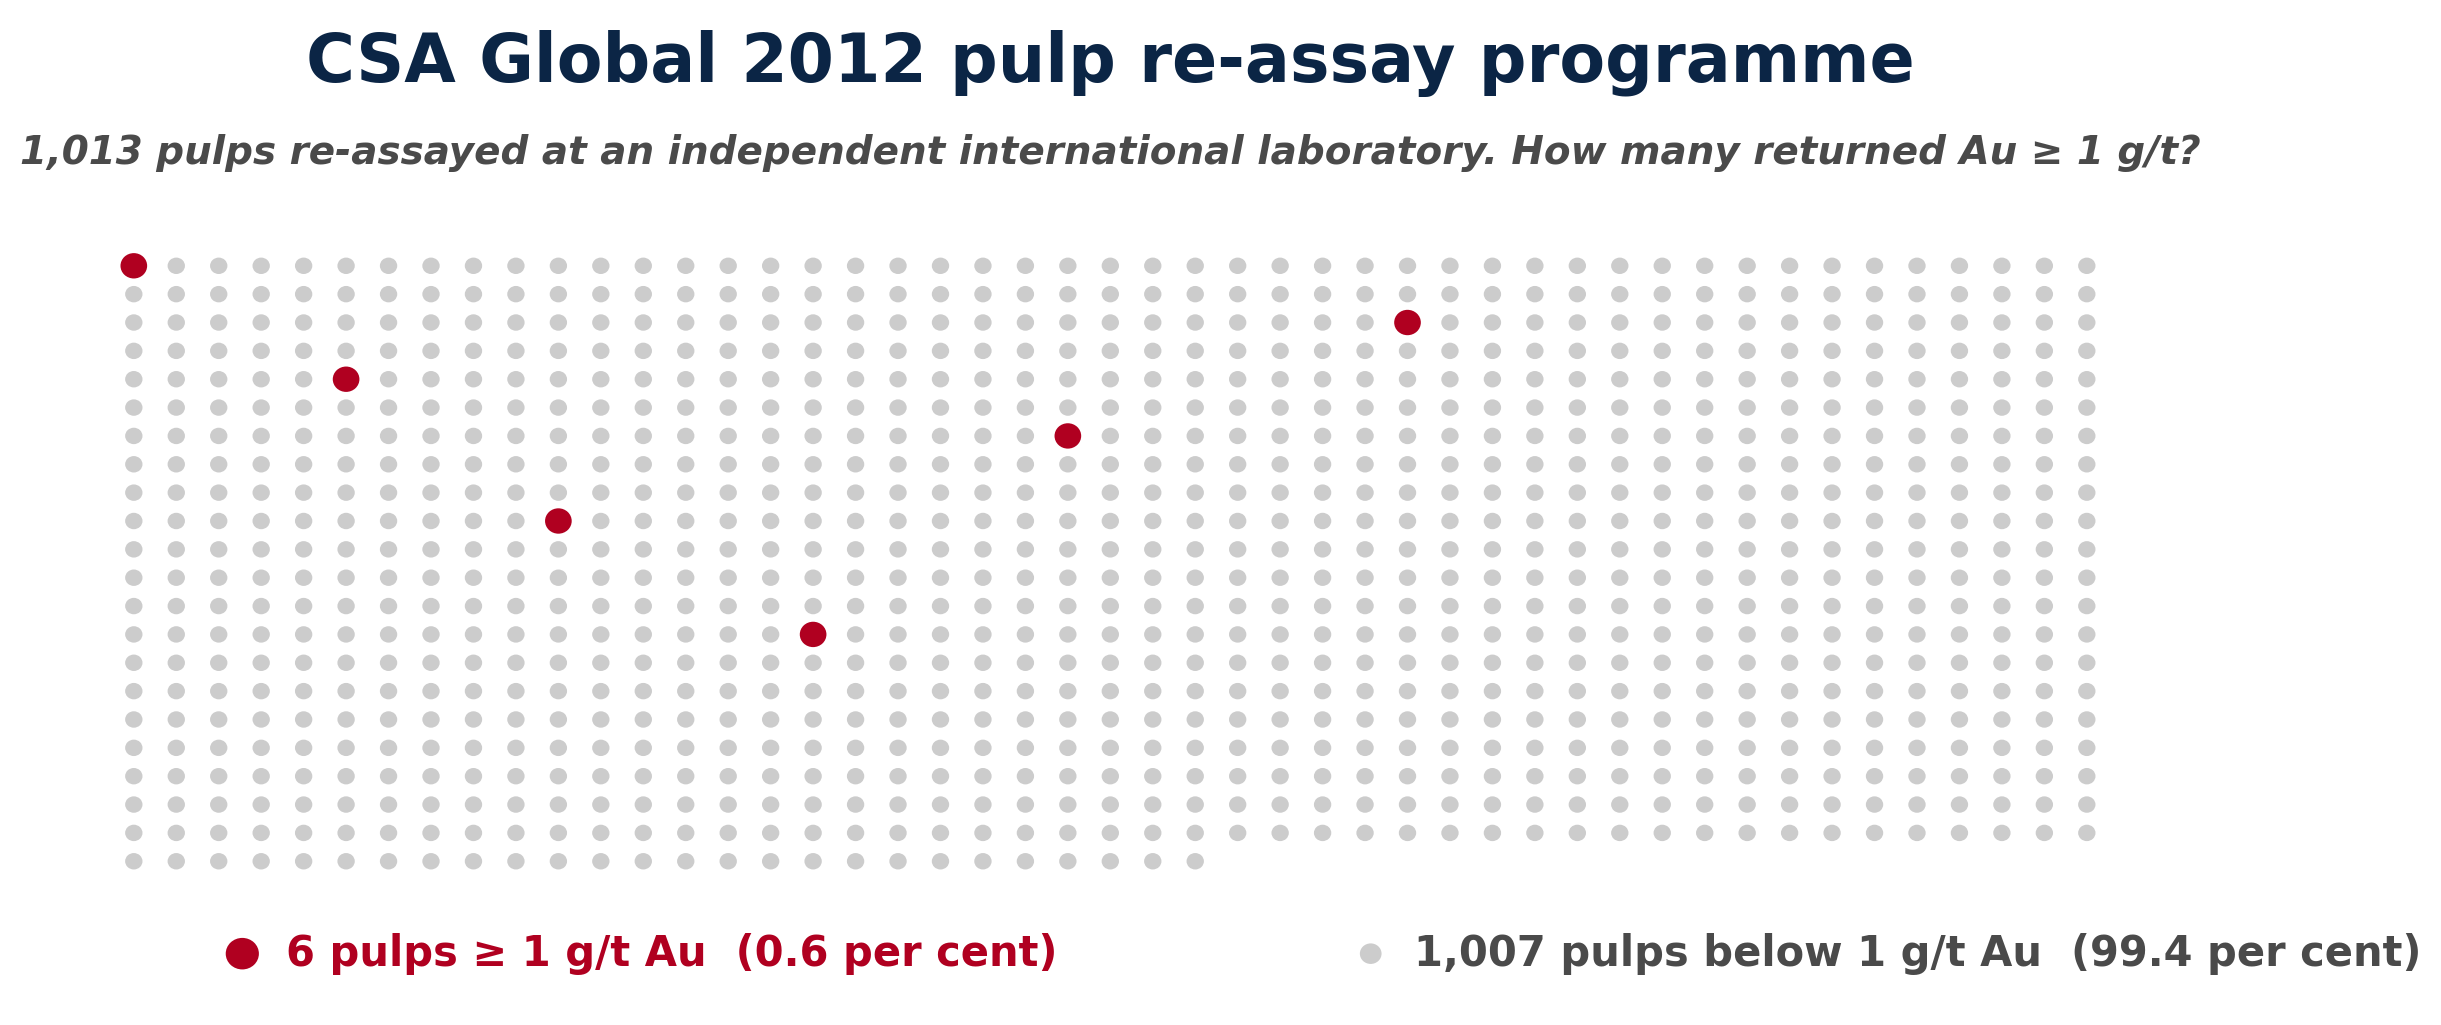
The first review, by CSA Global Pty Ltd. in April 2012, was a re-assay of 1,013 pulp samples at an independent international laboratory (ALS Romania). On the 551-pair subset with matched Global Gold database values, the mean gold grade in the independent re-assay was 0.09 g/t against 1.58 g/t reported by the operator for the same pulps — a 17.3× divergence. Only 6 of 1,013 pulps returned gold values at or above 1 g/t. The second, by 
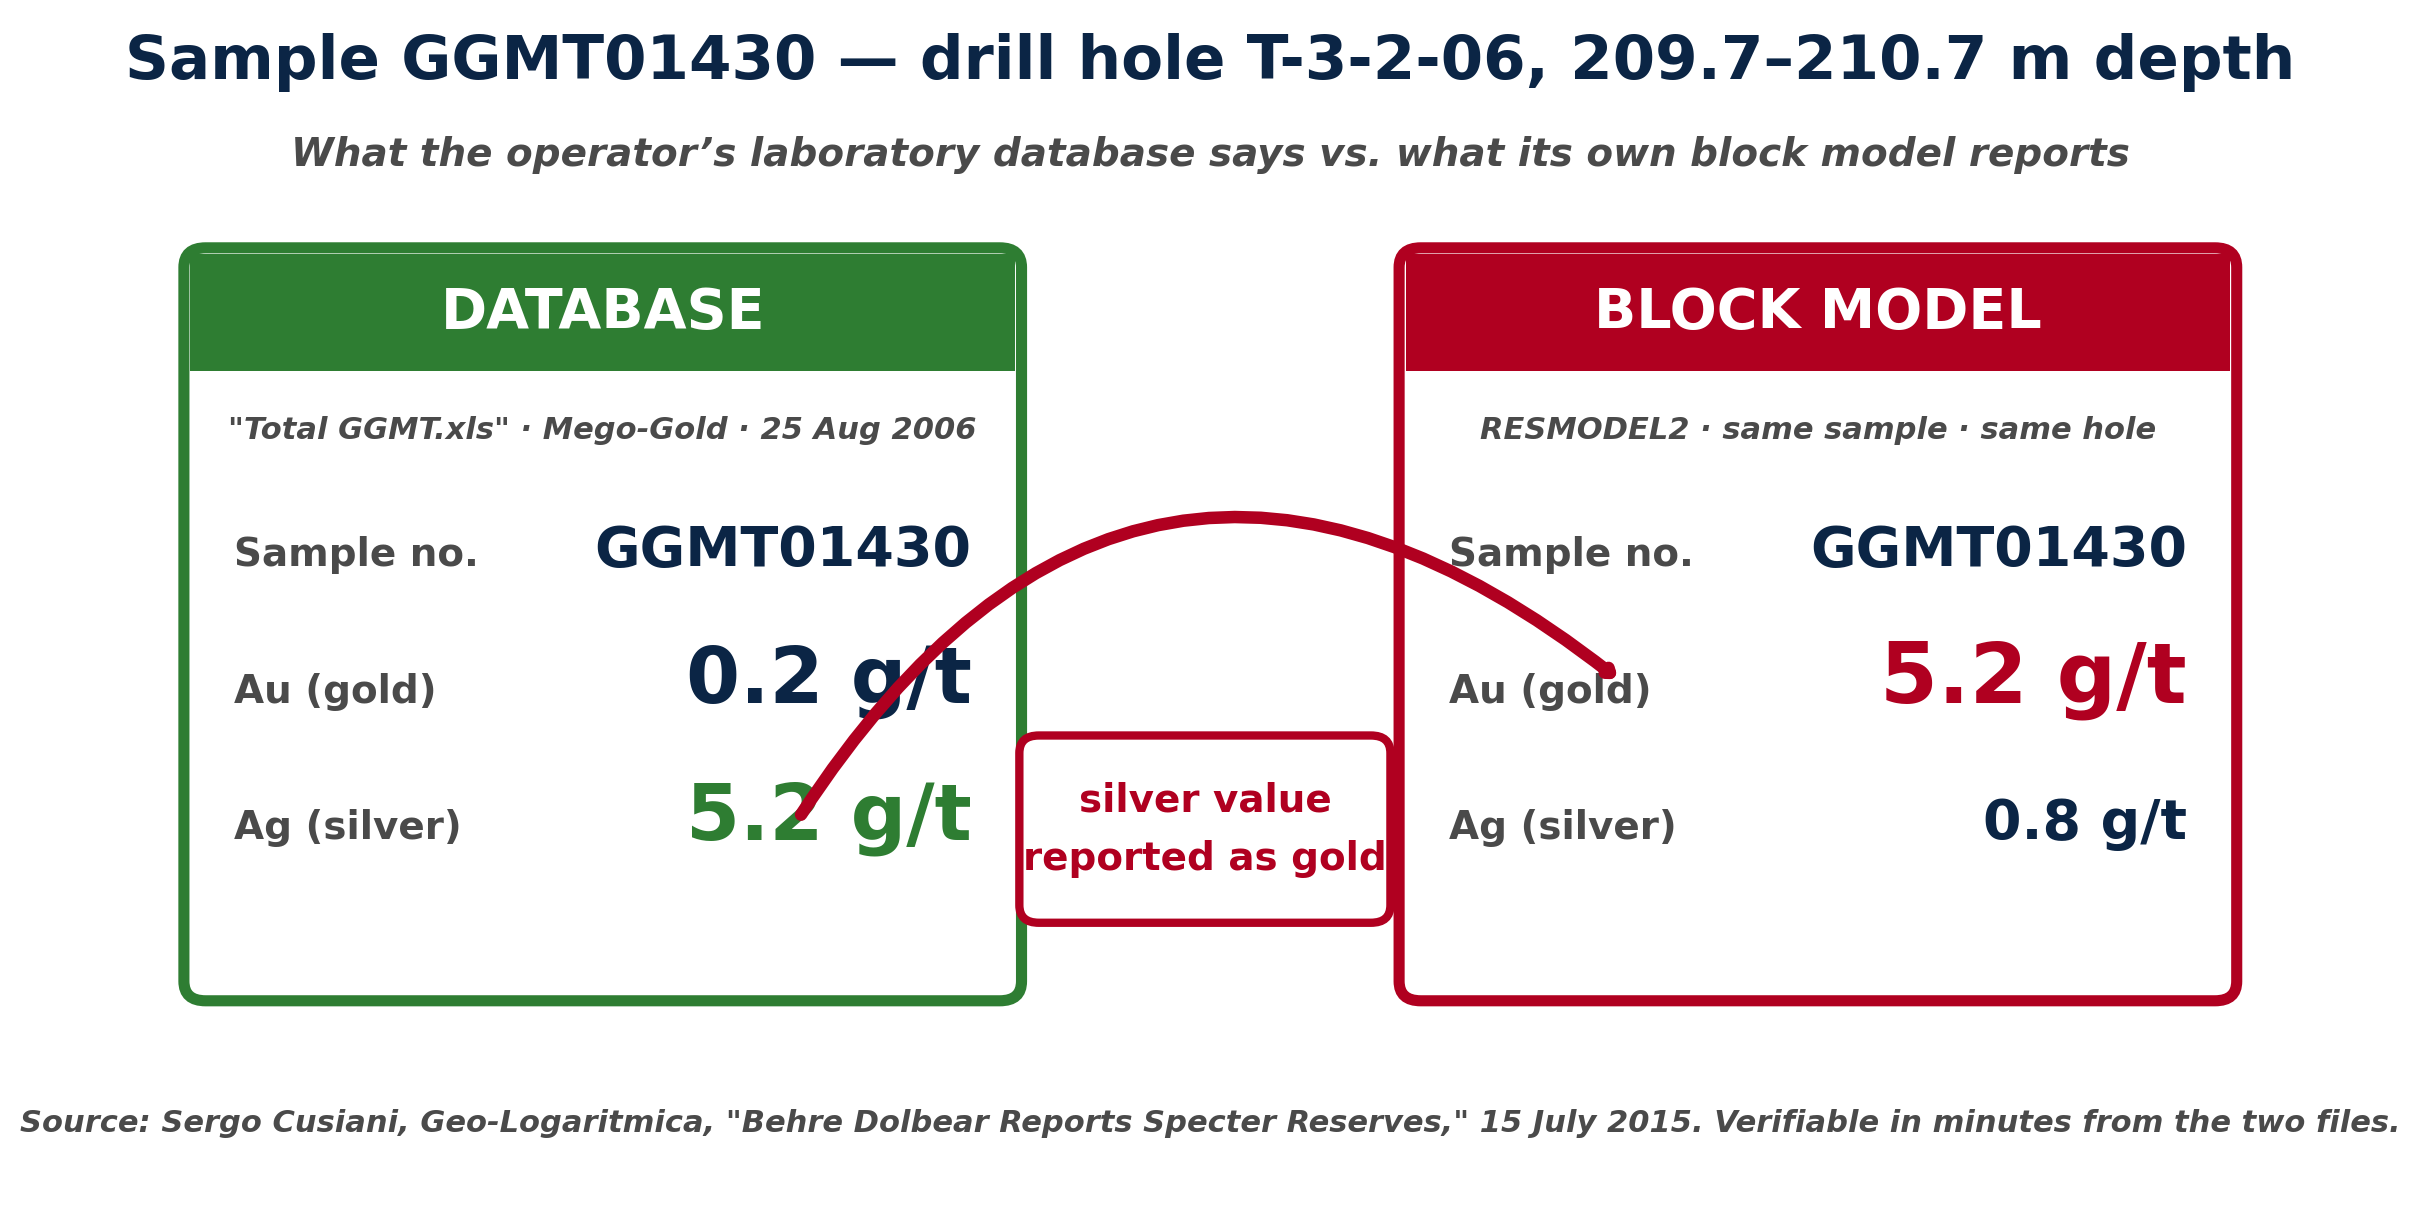
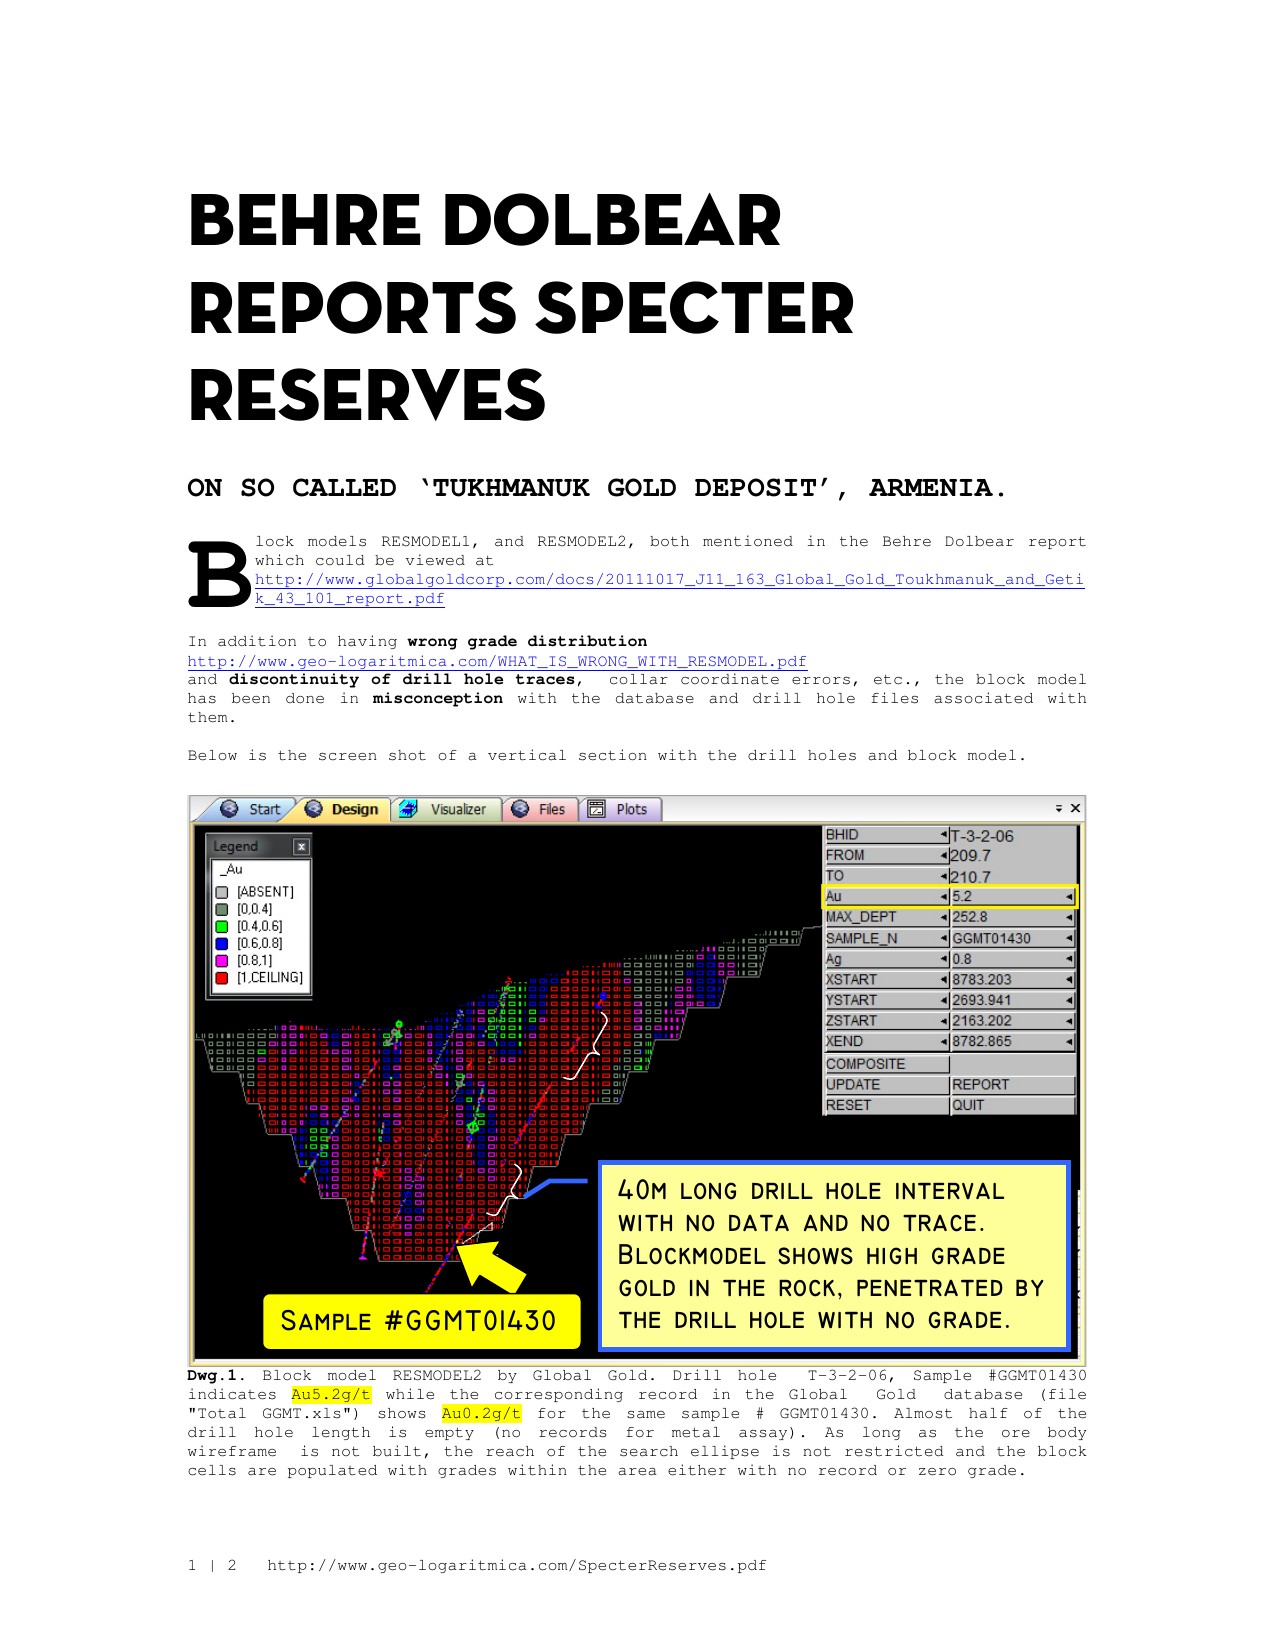
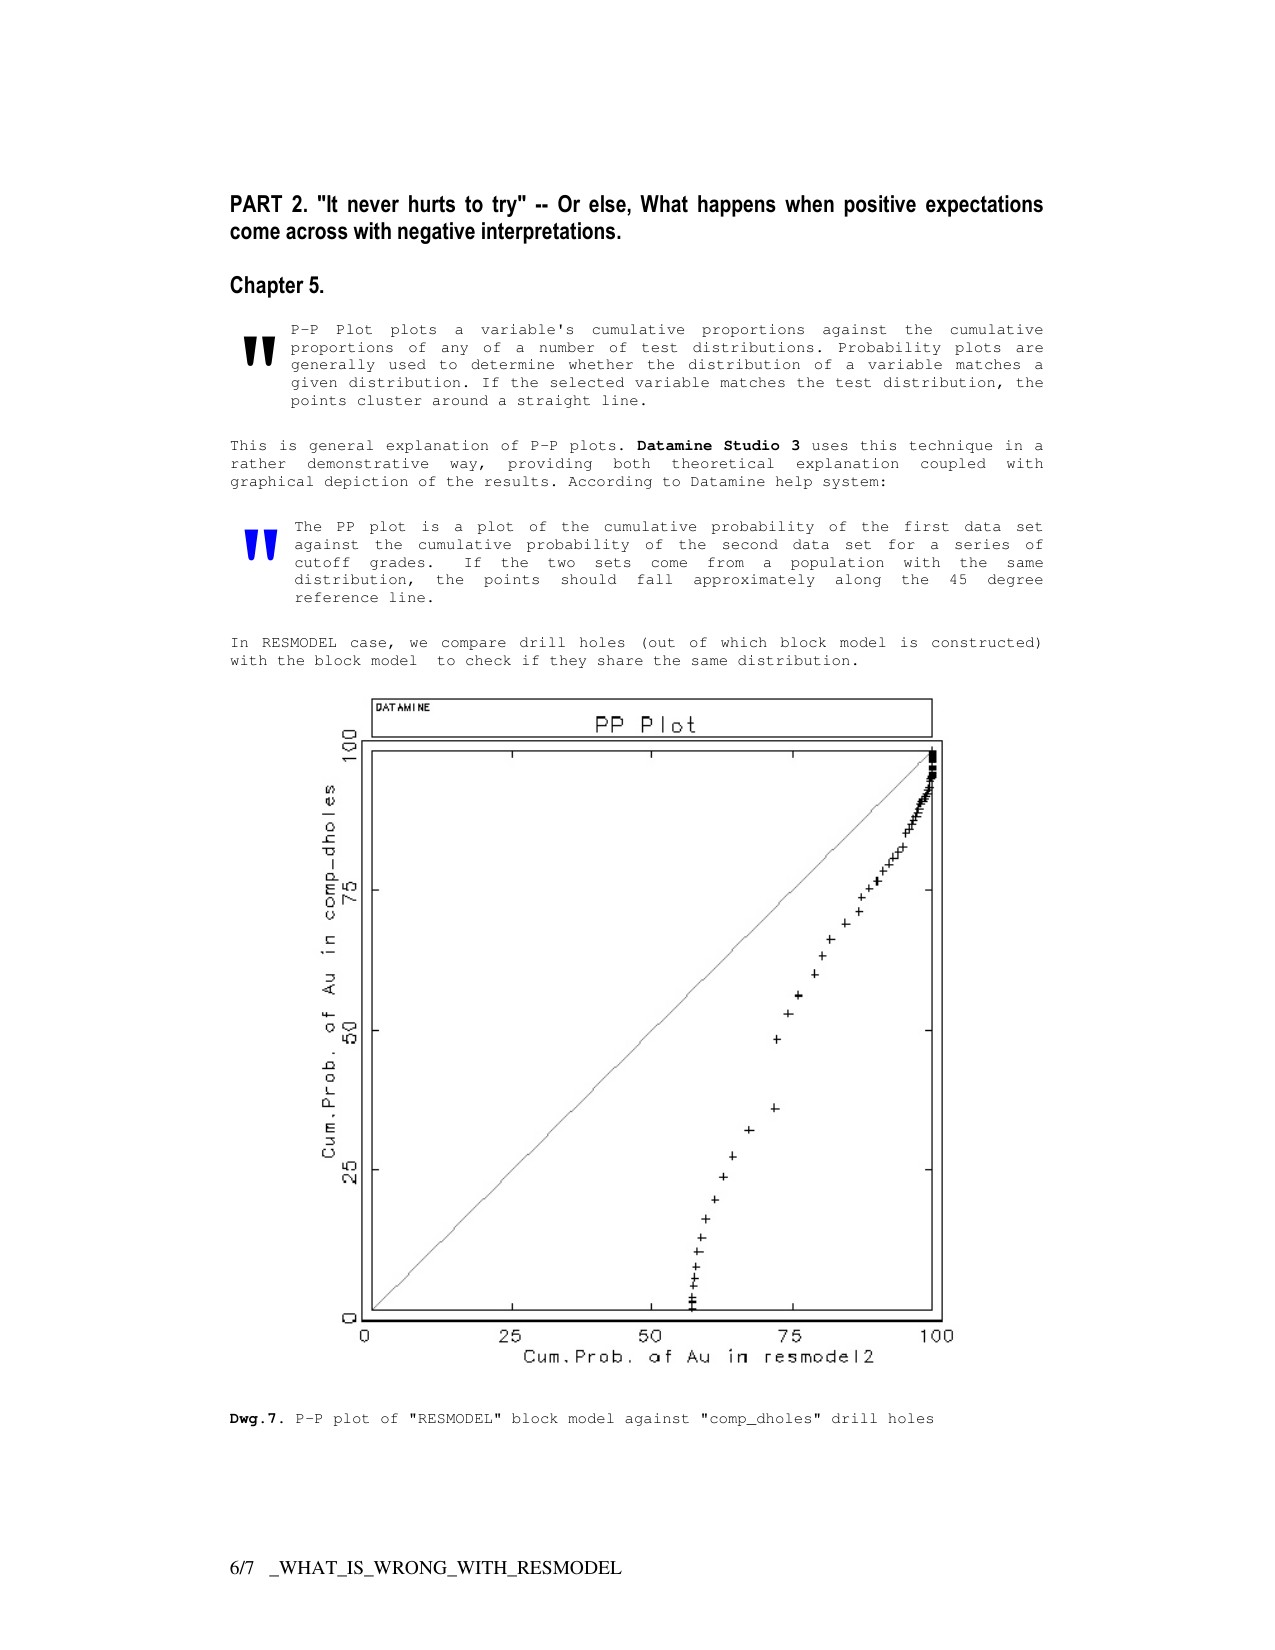
Sergo Cusiani of Geo-Logaritmica in 2014–2015, was a forensic analysis of the RESMODEL block model itself. It identified
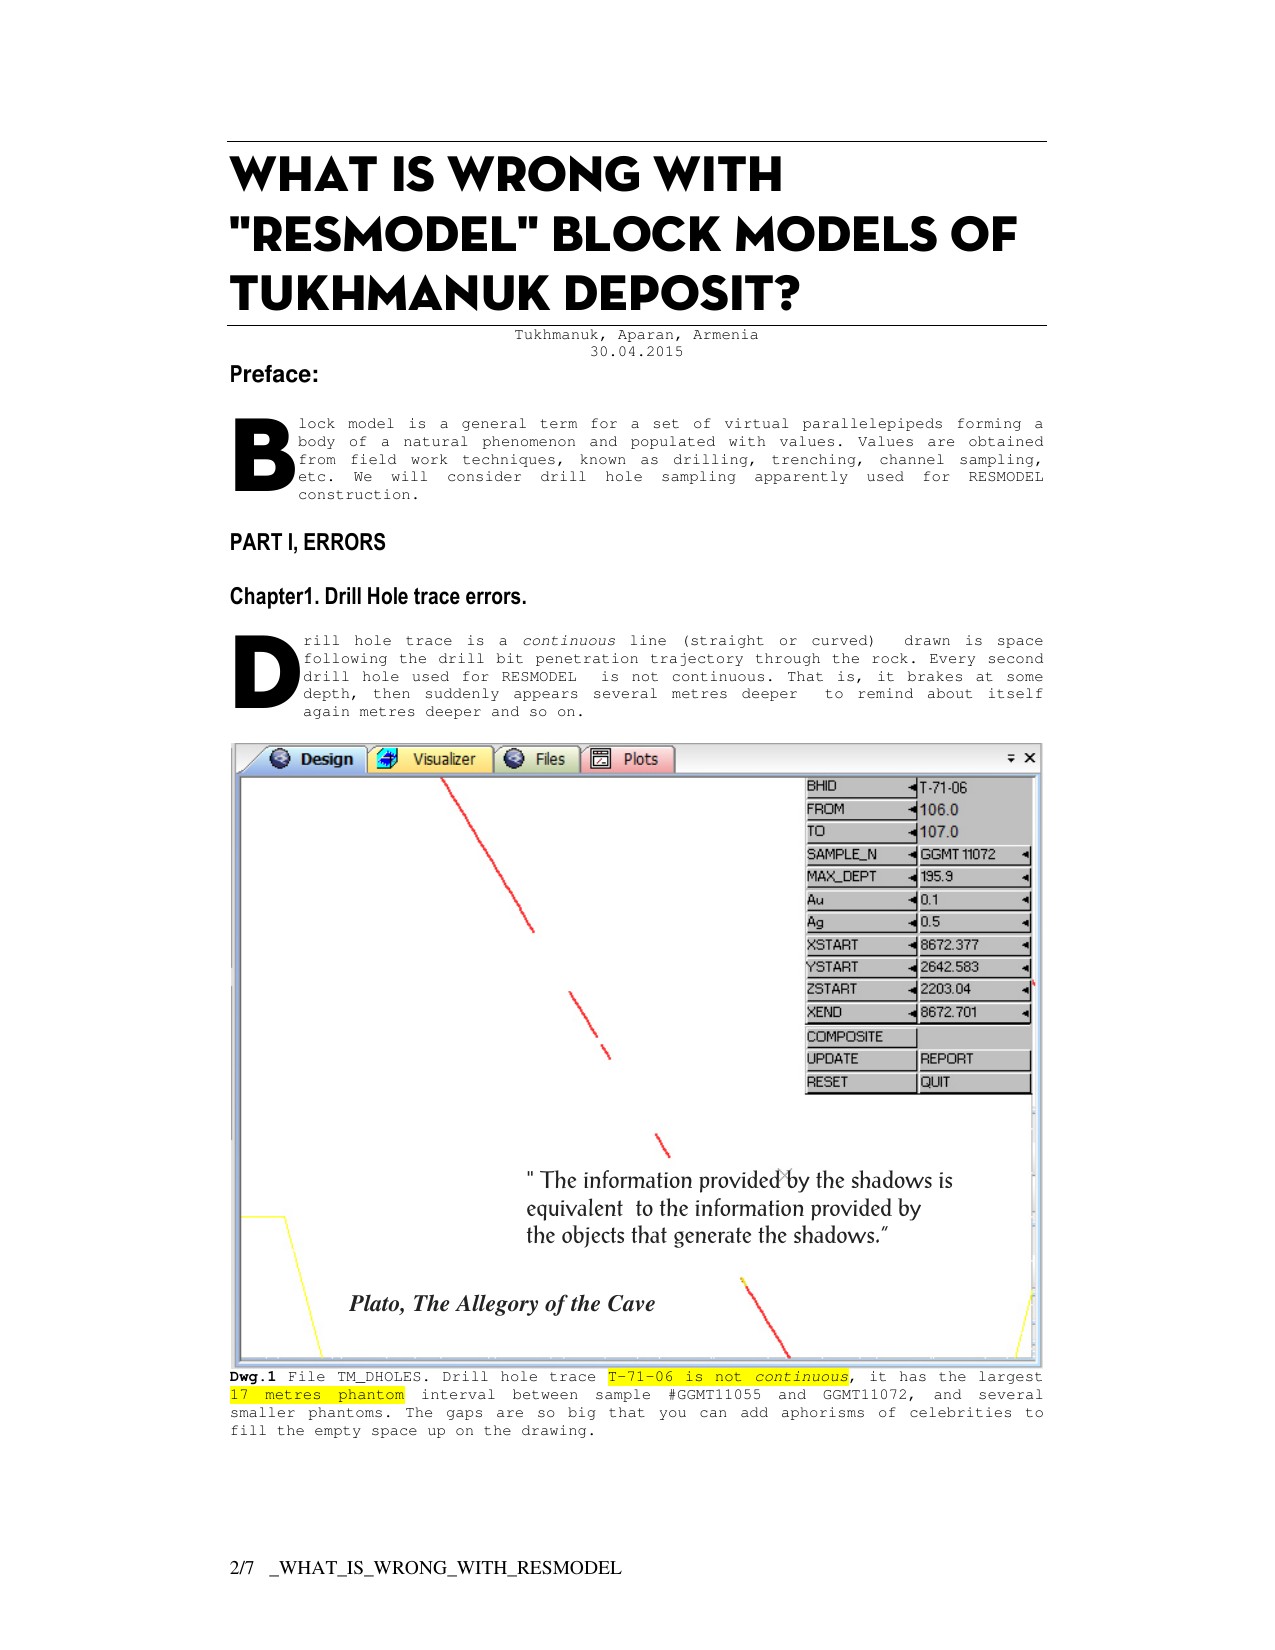
 discontinuous 
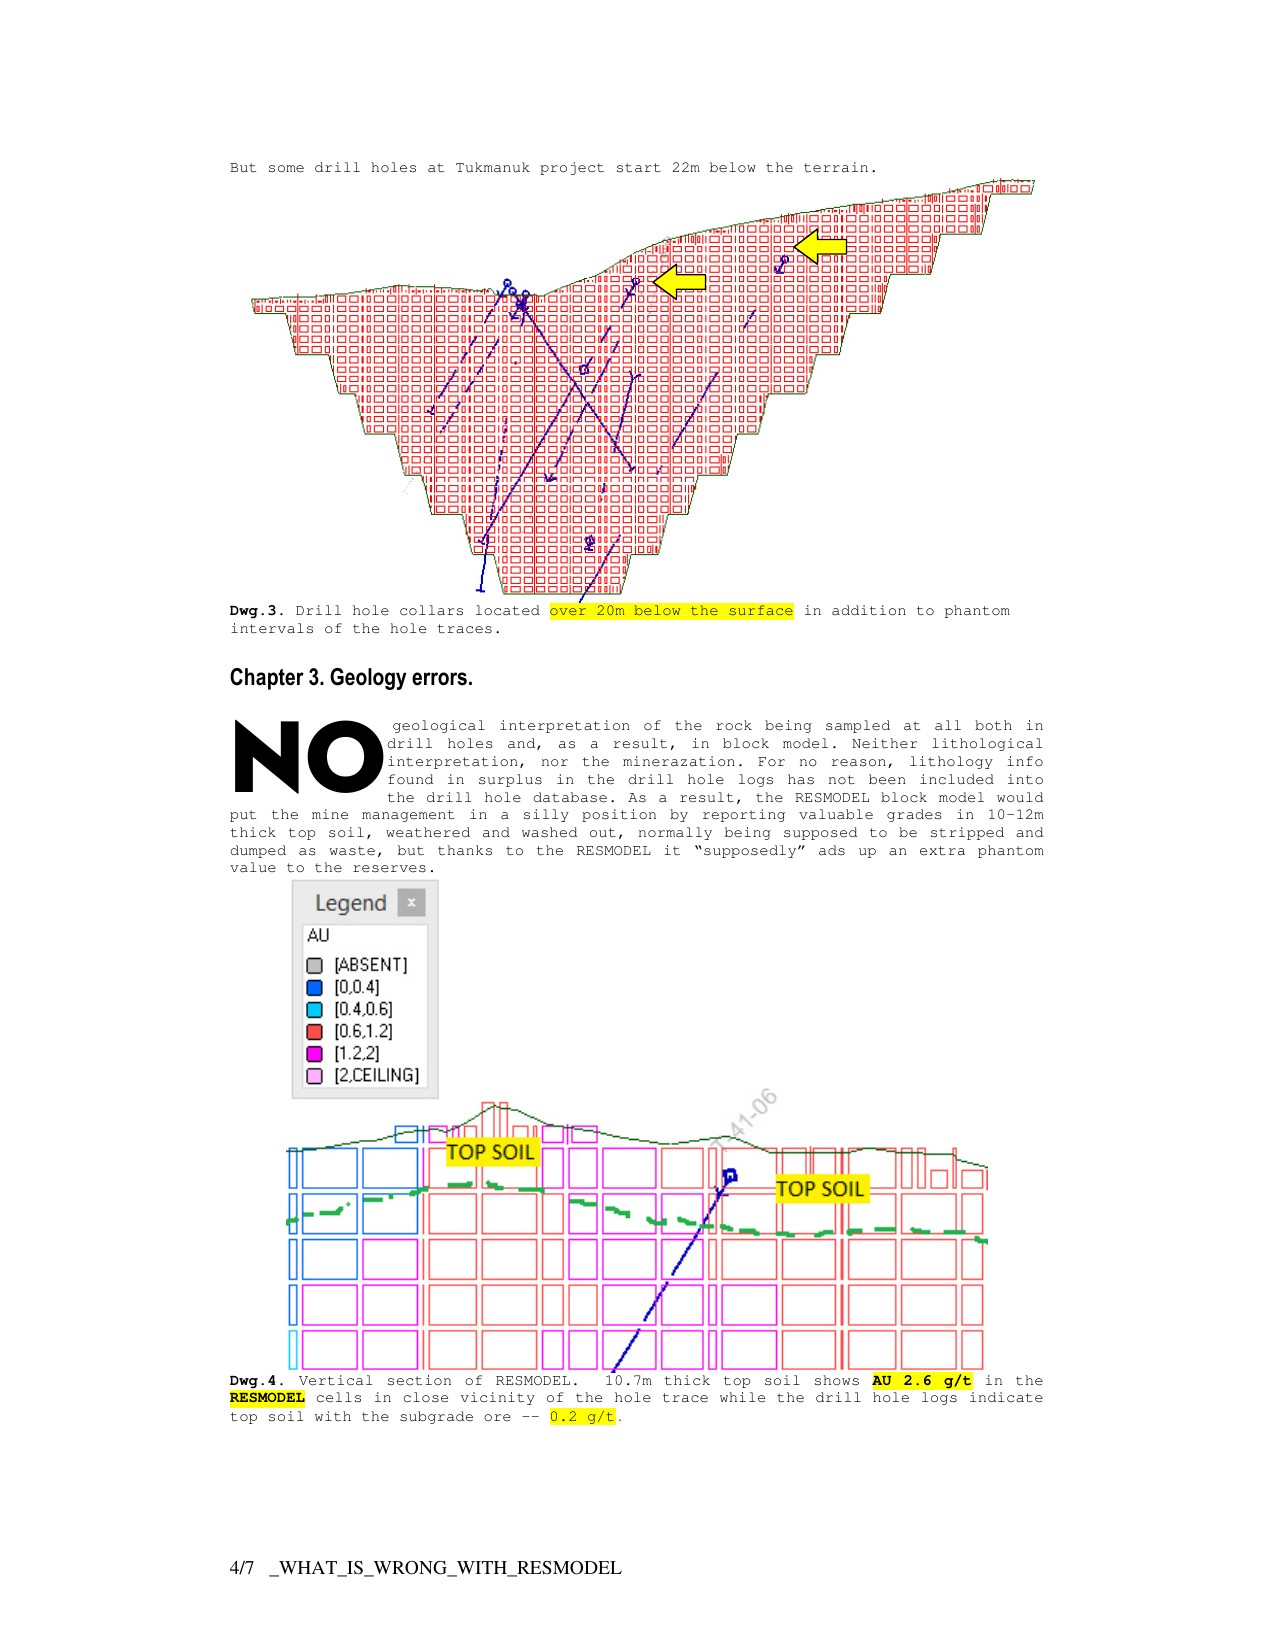
drill-hole traces, drill-hole collars placed twenty-two metres below the physical terrain, top-soil intervals reporting ore-grade gold, and — most consequentially 
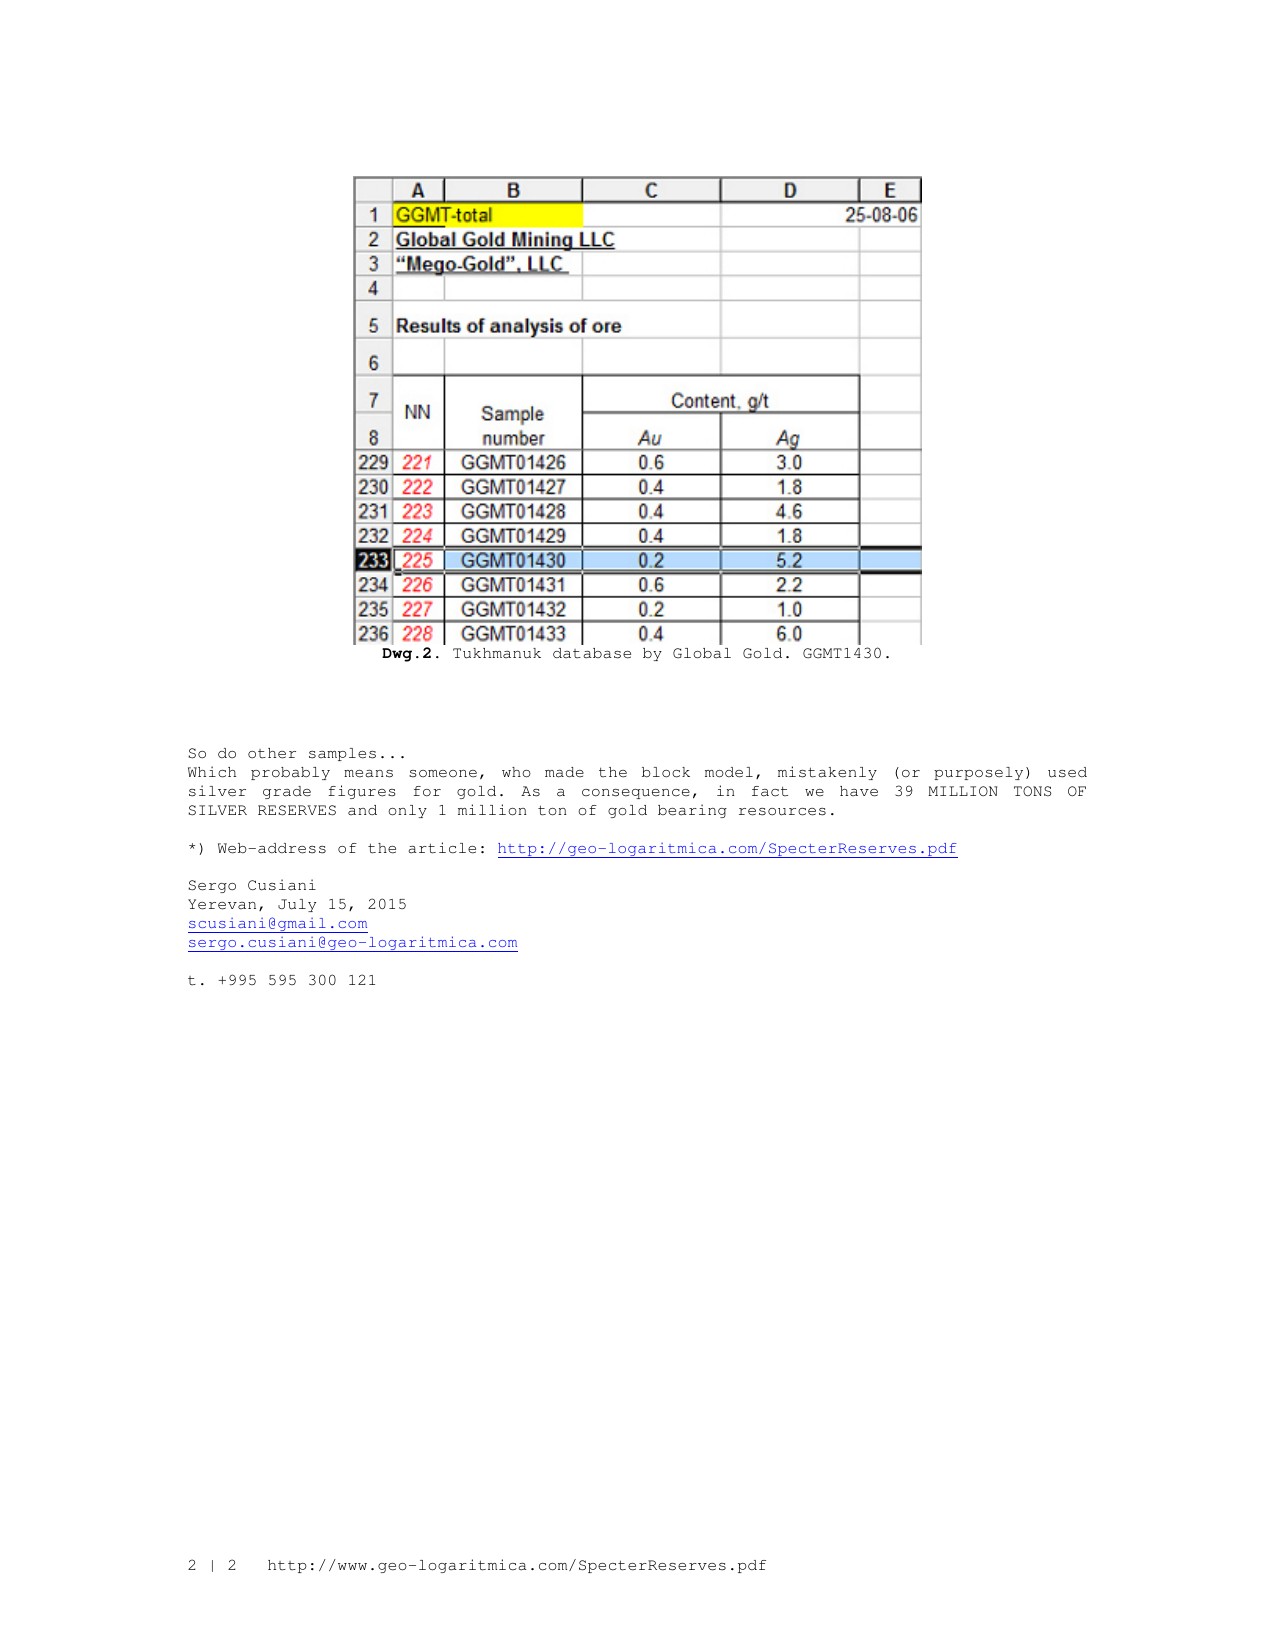
— a direct side-by-side demonstration, for a named sample on a named drill hole, that the “gold” value in the block model was the silver value from the operator’s own laboratory database.

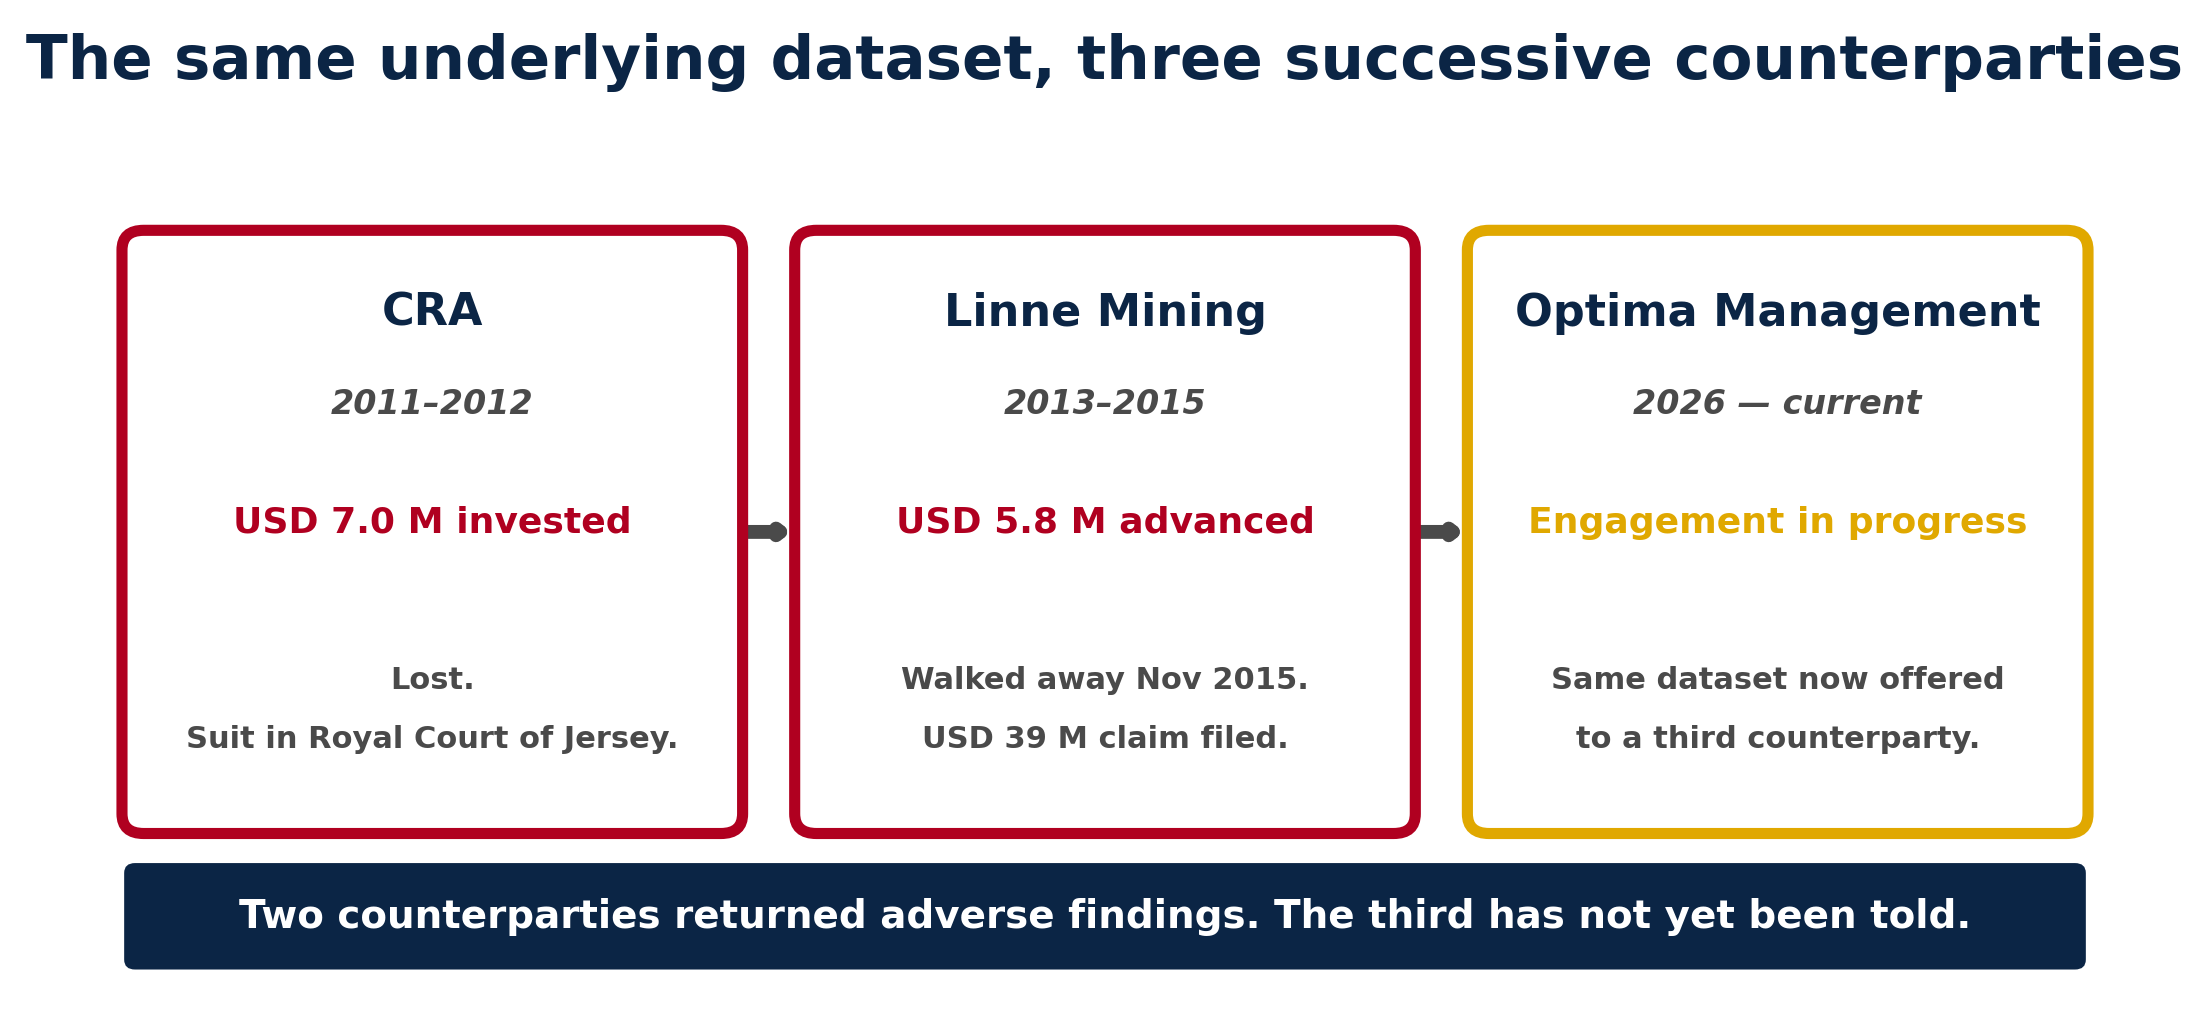
Consolidated Resources Armenia, the JV investor who commissioned the CSA work, lost its USD 7 million investment and sued in the Royal Court of Jersey. Linne Mining, the contract miner who commissioned the Cusiani work, walked away in November 2015, filed a USD 39 million creditor claim in the Mego-Gold bankruptcy, and disappeared. Both counterparties entered the transaction on the strength of the same assay database. The 2016 GKZ register is the product of that same database, untouched.

The commissioning record is on paper. CSA Global’s Toukhmanuk engagement began under Assignment Specification Agreement RAS.TRK.01, signed on 18 November 2011 by Van Z. Krikorian as Chairman for Global Gold Consolidated Resources Limited (Ogier House, St Helier, Jersey) and on 20 October 2011 by Malcolm Titley as Managing Director of CSA Global (UK) Ltd. The agreed scope, in the agreement’s own terms, includes “further QAQC review work and re-assaying”, laboratory audits of the site laboratory and the primary check laboratory facilities, and “NI-43-101 Compliant Mineral Resource Estimation and Reporting”. The 551-pair finding five months later was not a volunteered disclosure from outside: it was the output of a programme the signing party had commissioned by name.

Four numbers that define the case: 6 of 1,013 pulps, 2.6× grade inflation, zero findings disclosed, three counterparties.
Fig. 1 Four numbers that describe the record: a 1,013-pulp independent re-assay returning six positive samples; a 2.6× grade divergence between the operator’s lab and an independent lab on 1,500 duplicate pairs; none of it disclosed to the regulator; three successive counterparties invited to rely on the same dataset.
The fact that CSA produced what appears to be a negative report today only increases the importance of transparency. — Van Z. Krikorian, email, 20 April 2012, 17:21
§ 02  ·  What the commission never saw

Five adverse findings, four years, one disclosure of zero

Each of the items below existed in the operator’s possession before the 1 April 2016 reporting date. None were placed before the commission.

Timeline showing five adverse findings known to the operator between April 2012 and November 2015, and the single GKZ approval of November 2016.
Fig. 2 Five adverse findings in red, above the line, were in the operator’s possession. A single event in navy, below the line, is what reached the GKZ. Every dot is sourced in the document register.

1. CSA Global pulp re-assay, April 2012

  • 1,013 pulps re-assayed at ALS Romania. On the 551-pair subset with matched Global Gold database values, mean Au was 0.09 g/t (ALS) vs. 1.58 g/t (Global Gold database) — a 17.3× divergence.
  • Paired t-statistic: 20.14 against a 1.96 threshold.
  • 99.8% of gold pairs fall outside ±10% limits.
  • 6 of 1,013 pulps returned Au ≥ 1 g/t; only 11 returned Ag ≥ 5 g/t.
  • David Muir’s email, 20 April 2012: “The correlation is poor… Sorry to be giving you such bad news.”
  • Van Z. Krikorian acknowledged receipt in writing the same hour. Not disclosed to the GKZ.
  • → Read the CSA correlation report

3. Cusiani RESMODEL forensic review, April 2015

  • Drill hole T-71-06: 17-metre phantom gap between samples GGMT11055 and GGMT11072.
  • Drill hole T-27-06: a 40-metre phantom gap — “can accommodate several drill rigs.”
  • Drill-hole collars placed up to 22 m below physical terrain.
  • Top-soil horizons (0.2 g/t in the logs) reported in the model at 2.6 g/t Au.
  • P-P plot: block model and its input drill holes are statistically different populations.
  • → Read the report (PDF)

4. Cusiani GGMT01430 side-by-side, July 2015

  • Drill hole T-3-2-06, interval 209.7–210.7 m, sample GGMT01430.
  • Database file “Total GGMT.xls” (Mego-Gold, 25 Aug 2006): Au 0.2 g/t, Ag 5.2 g/t.
  • RESMODEL2 block model for the same sample: Au 5.2 g/t.
  • The silver value in the database has been reported as the gold value in the model.
  • Not disclosed. Verifiable in minutes from the two files.
  • → Read the report (PDF)

5. Linne Mining walk-away, November 2015

  • Contract miner engaged in July 2013 to operate the Toukhmanuk open pit.
  • Walked away in November 2015 citing falsified assays.
  • USD 5.8 million advanced; USD 39 million creditor claim filed in Mego-Gold bankruptcy.
  • Five months before the 1 April 2016 GKZ reporting date. Not disclosed.
  • → SEC 8-K, 5 July 2013

6. The operator was itself in bankruptcy

  • Mego-Gold LLC entered bankruptcy proceedings in Armenia in September 2015.
  • Proceedings active throughout the GKZ review period.
  • Armenian government representatives confirmed the project bankrupt at PDAC, Toronto, March 2018.
  • Not disclosed in the operator’s 2016 filing to the commission.
  • → See full briefing (PDF)
USD 7 M
Lost by CRA, 2011–2012
Joint-venture investor
USD 5.8 M
Advanced by Linne Mining, 2013–2015
Contract miner
USD 39 M
Creditor claim filed
in Mego-Gold bankruptcy
USD 20.9 M
Global Gold Corp. liabilities
at Dec 2017 SEC exit
§ 03  ·  One sample, two numbers

Sample GGMT01430 is the whole case in one line

One named sample. One named drill hole. The operator’s own database against the operator’s own block model.

Side-by-side of the Mego-Gold laboratory database entry for sample GGMT01430 and the RESMODEL2 block model entry for the same sample. Database records Au 0.2 g/t and Ag 5.2 g/t; block model records Au 5.2 g/t. An arrow shows the silver value has been relabelled as the gold value.
Fig. 3 Sample GGMT01430 from drill hole T-3-2-06, depth 209.7–210.7 m. In the operator’s own laboratory database, Au is 0.2 g/t and Ag is 5.2 g/t. In the operator’s own block model, the same sample shows Au at 5.2 g/t. The silver value is being reported as the gold value. Verifiable in minutes from the two files.

This is not a statistical inference. It is not a trend across an averaged population. It is a side-by-side of one cell in one file against the corresponding cell in another file, published by the same operator, for the same sample, on the same drill hole, at the same depth interval.

In the database: gold 0.2 g/t, silver 5.2 g/t — a plausible Armenian polymetallic vein assay. In the block model: gold 5.2 g/t. The silver value has migrated into the gold column. Run across the database, the same substitution would inflate the aggregate gold grade and deflate the aggregate silver grade exactly in the direction the 2016 GKZ tables show: Ag:Au ratios of 2.1:1 to 3.0:1 at Toukhmanuk, against a district norm of 10:1 to 30:1 for comparable Armenian polymetallic veins.

Cusiani put the observation plainly: “Someone, who made the block model, mistakenly (or purposely) used silver grade figures for gold.” The whole case turns on whether that was an isolated error or a systemic one. The raw database answers that question. It has not been produced.

Exhibit A · The 20 April 2012 email chain

Hi Joe, We have completed a preliminary assessment. The correlation is poor — 6 out of 1,013 pulp assays have gold values of 1 g/t or greater, the balance all below 1 g/t. Sorry to be giving you such bad news, but we thought it important you get an indication as soon as possible. Dave Muir, CSA Global Pty Ltd.
A little while ago I received the email from Joe Borkowski … The fact that CSA produced what appears to be a negative report today only increases the importance of transparency.
§ 04  ·  The peer test

The claim sits above every Armenian benchmark

Toukhmanuk’s claimed grade against the closest Armenian peer, Kapan / Shahumyan — the only narrow-vein deposit with a published reserve grade and a reconciled mined grade.

Horizontal bar chart comparing Toukhmanuk's claimed gold grades against Kapan / Shahumyan reserve and mined grades, and against the Cusiani rebuild on Linne data.
Fig. 4 Toukhmanuk Southern C1 at 6.69 g/t Au sits above every published Armenian comparator on the chart — including Kapan’s AuEq reserve of 4.20 g/t (which includes silver, copper and zinc credits) and Kapan’s reconciled mined grade of 1.53 g/t from actual 2006–2011 production. Cusiani’s rebuild on the Linne Mining data shows 0.86 g/t.

Kapan / Shahumyan, in Syunik Province, is the nearest geological analogue to Toukhmanuk available for comparison. It is a narrow-vein polymetallic system with sub-vertical veins of 20 cm–3 m thickness, Au-Ag-Cu-Zn-Pb mineralogy, Middle Jurassic volcanic hosts, a pyrite-chalcopyrite-galena-sphalerite assemblage. It is also, critically, the only Armenian narrow-vein deposit with both a published reserve grade and publicly reconciled mined grade from actual production.

Kapan’s 2006–2011 reconciled mined grade was 1.53 g/t Au, against a contemporaneous reserve grade of 2.74 g/t Au. That is roughly 56 per cent reserve-to-mill reconciliation — a typical figure for narrow-vein systems where dilution, selective-mining difficulty and vein pinch loss drag actual mined grade below reserve. If Toukhmanuk’s 5.00 g/t reserve reconciled to a similar ratio, the actual mined grade would land in the 2.8–3.5 g/t range — still above Cusiani’s rebuild but well below the figure registered by the state.

The register, in short, is not a conservative figure. It is the upper end of what the operator was claiming, approved in spite of unresolved commission-level doubts.

§ 05  ·  The commercial pattern

The same dataset, offered three times

Each successor commercial vehicle has relied on the 2016 state register or its predecessors. That is the register’s intended function — which is why the non-disclosure matters.

Three counterparties in succession: CRA lost USD 7M, Linne Mining advanced USD 5.8M and walked away, Optima Management is the current counterparty.
Fig. 5 Each counterparty entered on the strength of the same assay database. Two returned adverse findings; neither recovered their investment. The third has not yet been told.
§ 06  ·  The CSA programme visualised

1,013 pulps. Six returned gold. A 17.3× divergence across the paired subset.

Two charts drawn from the same source documents — the CSA Correlation Report of 20 April 2012 and the 551-pair paired spreadsheet that accompanies it.

Bar chart comparing mean gold grade: 0.09 g/t from ALS Romania re-assay versus 1.58 g/t from Global Gold database, a 17.3-times divergence. Paired t-statistic 20.14.
Fig. 6 On the 551 paired samples, the mean gold grade reported by Global Gold was 17.3 times the mean gold grade the same pulps returned at ALS Romania. Paired t-statistic 20.14, against a significance threshold of 1.96. 99.8 per cent of pairs fell outside the ±10 per cent correlation band. The silver divergence on the same pairs was 6.0× (0.69 g/t ALS vs. 4.15 g/t Global Gold). Verifiable from the source spreadsheet →
A dot grid rendering of the CSA Global 2012 pulp re-assay programme. 1,007 grey dots represent pulps below 1 g/t Au; six red dots represent the six pulps above 1 g/t.
Fig. 7 Each dot is one of the 1,013 pulps. Six red dots are the six pulps that returned Au ≥ 1 g/t. The remaining 1,007, or 99.4 per cent, returned below 1 g/t. Only 11 pulps out of 1,013 returned silver at 5 g/t or above — silver is substantially absent even in the pulps themselves.
§ 07  ·  The economic consequence

Three grade figures. Three different ore bodies. Three different economies.

What it would cost to mine each of the three available grade figures, on the same $42.75 per tonne of ore operating cost. Benchmarked at a $3,500/oz gold price.

A dispute over gold grade is ultimately a dispute about whether there is a mine, and at what scale. Three independent figures exist for Toukhmanuk: the 2016 GKZ-registered grade of 5.00 g/t, the Cusiani rebuild on Linne data at 0.86 g/t over a five-year plan, and the CSA 551-pair re-assay mean of 0.09 g/t. These are not variations on a theme. They describe three economically different ore bodies.

The table below holds the operating cost per tonne of ore constant at USD 42.75 per tonne — mining at $3.25/t mined with 5:1 strip ($19.50/t ore), processing at $22.00/t ore, and G&A at $1.25/t ore. These unit costs are benchmarked to recent open-pit polymetallic feasibility studies: Arctic (Trilogy Metals, Alaska) at $3.00/t mined, Integra DeLamar at $2.74/t mined, the 130 Mt Whittle model at $2.28/t ore. A $0.50/t uplift has been added for Armenia’s remoteness and diesel dependency.

Three scenario panels showing AISC per ounce at a $3,500 per ounce gold price. 2016 GKZ registered at 5.00 g/t Au yields $617 per ounce (bottom-quartile global). Cusiani rebuild at 0.86 g/t yields $2,072 per ounce (economic but modest). CSA adverse at 0.09 g/t yields $17,104 per ounce (catastrophically uneconomic).
Fig. 8 At $3,500/oz gold: the 2016 GKZ scenario places Toukhmanuk in the bottom quartile of global gold producers; the Cusiani rebuild is economic but at roughly one third the per-ounce multiple; the CSA-informed scenario loses more than $13,000 per ounce. Desktop estimate, ±25 per cent.

Sensitivity across the $3,000–$4,500 gold-price band

A single-price table is misleading in isolation. Gold itself is uncertain. The matrix below extends the analysis across the price range that brackets current spot and the five-year forward range used by bank research desks.

Metric Scenario $3,000/oz $3,500/oz $4,000/oz $4,500/oz
AISC per ounce2016 GKZ (5.00 g/t)$597$617$637$657
Cusiani (0.86 g/t)$2,052$2,072$2,092$2,112
CSA (0.09 g/t)$17,084$17,104$17,124$17,144
Margin per ounce2016 GKZ+$2,403+$2,883+$3,363+$3,843
Cusiani+$948+$1,428+$1,908+$2,388
CSA−$14,084−$13,604−$13,124−$12,644
Margin as % of revenue2016 GKZ80%82%84%85%
Cusiani32%41%48%53%
CSA(loss)(loss)(loss)(loss)
Margin per tonne of ore2016 GKZ+$340+$408+$476+$544
Cusiani+$23+$35+$46+$58
CSA−$36−$35−$33−$32
Break-even grade(common)0.56 g/t0.47 g/t0.41 g/t0.36 g/t
Line chart showing operating margin per ounce of gold from $3,000 to $4,500 gold price. Green line for GKZ scenario rises from $2,403 to $3,843. Amber line for Cusiani rises from $948 to $2,388. A bordered annotation at bottom notes CSA adverse case sits between minus $14,084 and minus $12,644 across the entire band, uneconomic at any gold price.
Fig. 9 Operating margin per ounce of gold across the gold-price band. Every $500/oz gold price rise yields a uniform $480/oz of additional margin in all three scenarios — the 4% royalty claims the other $20. The CSA adverse case remains uneconomic at any gold price in the range.
Grouped bar chart showing operating margin per tonne of ore processed at each of four gold prices. GKZ bars rise from $340 to $544. Cusiani bars rise from $23 to $58. CSA bars sit at minus $36 to minus $32. Annotation shows 9.4x gap between GKZ and Cusiani at $4,500 gold.
Fig. 10 Operating margin per tonne of ore processed — the leverage view. The gap between the GKZ and Cusiani scenarios grows as gold price rises, from $317/t at $3,000 gold to $486/t at $4,500 gold. Higher gold prices widen, not narrow, the economic consequence of knowing which grade is real.

Four analytical conclusions

1

The CSA scenario is not rescued by higher gold prices.

AISC of $17,100/oz sits so far above any conceivable gold price that even a $4,500/oz world leaves the mine losing $12,644/oz. The $1,500/oz price band studied moves the loss by only $1,440/oz — approximately 11 per cent of total loss — because price-dependent costs (royalty) are a trivial fraction of the loss. At this magnitude the mine would not run; it would be stripped as waste rock.

2

The Cusiani rebuild is fully economic across the entire price range.

Even at $3,000/oz, operating margin is $948/oz (32% of revenue). At $4,500/oz it reaches $2,388/oz (53% of revenue). This is a viable open-pit gold mine at any realistic gold price — but a fundamentally different mine from the one the 2016 register implies: three quarters smaller per tonne of rock processed, with roughly one third the per-ounce valuation multiple a market would pay for the GKZ scenario.

3

Margin uplift per +$500/oz gold is uniform per ounce across scenarios.

Each additional $500/oz gold price yields exactly $480/oz of additional margin in every scenario (the 4% royalty on the $500 uplift claims the other $20). What differs radically is the translation to per-tonne economics: the same $1,500/oz rally lifts the GKZ scenario by $204/t of ore, the Cusiani scenario by only $35/t, and the CSA scenario by a trivial $4/t. Low-grade scenarios benefit less in absolute dollars per tonne of rock processed, because there is less gold in each tonne for the price change to operate on.

4

The reserves-level valuation swing is $1.14 billion at $3,500/oz gold.

On the 2.57 Mt registered tonnage, undiscounted operating margin at $3,500/oz gold is: ~$1.05 billion if the GKZ 5.00 g/t figure is correct; ~$90 million if the Cusiani 0.86 g/t rebuild is correct; minus $90 million if the CSA 0.09 g/t mean is correct (i.e., the operator loses value by processing the rock). A $1.14 billion valuation swing on a single reserves file — held between three grade figures all of which appear in the documentary record — cannot be resolved by any operator, regulator or counterparty on the strength of arithmetic alone. It requires an independent sample re-verification programme. The same programme CSA Global ran in 2012, and Linne Mining and Cusiani ran in 2014–2015, and that was not placed before the GKZ commission.

The commercial consequence for a counterparty evaluating Toukhmanuk today is that gold-price environment is not the primary uncertainty. Gold could double tomorrow and the CSA scenario would still be uneconomic; gold could halve and the GKZ scenario would still be top-quartile. The primary uncertainty — and the one any due-diligence programme must answer first — is the grade itself.

Methodology: Figures are a desktop estimate with indicative band ±25 per cent. Gold recovery 88 per cent. Royalty 4 per cent NSR. TC/RC and refining $25/oz. Sustaining capex $150/oz. The Armenian cost base is not directly represented in the Western comparable set; local labour is cheaper, but diesel and imported spares are more expensive. Polymetallic credits could reduce unit cost in the GKZ and Cusiani scenarios, though the CSA data suggests silver is substantially absent even at pulp level (11 of 1,013 pulps at Ag ≥ 5 g/t), so by-product credits in the 2016 model may be subject to the same reliability concern as the gold figures.

§ 09  ·  Chronology

A fifteen-year record

2005–2006
Global Gold Corp. acquires the Toukhmanuk property Licence area 53.76 km². Mining begins under the 2012 exploitation licence ԵՀԹ 29/136.
Oct 2011
Behre Dolbear 43-101 technical report Claims 39.23 Mt at 2.1 g/t Au. Report states on its face that Behre Dolbear performed no independent exploration, drilling, sampling or analyses. Read the 43-101 report (PDF) →
Mar 2011
CRA joint-venture agreement signed SEC Form 8-K, 17 March 2011. Consolidated Resources Armenia advances USD 7 million.
Nov 2011
CSA Global contract executed Assignment Specification Agreement RAS.TRK.01 signed 18 November 2011 by Van Z. Krikorian as Chairman for Global Gold Consolidated Resources Limited (Jersey), and 20 October 2011 by Malcolm Titley as Managing Director of CSA Global (UK) Ltd. Scope includes “further QAQC review work and re-assaying”, laboratory audits, and NI-43-101 compliant mineral resource estimation. Fee £34,415 excluding VAT; £10,000 advance required. Read the executed contract (PDF) →
Apr 2012
CSA Global pulp re-assay programme 1,013 pulps tested. Six return Au ≥ 1 g/t. David Muir delivers the finding by email 20 April 2012. Final report never paid for. See email exhibit →
2012–2014
CRA loses its investment; files in the Royal Court of Jersey CSA Global report remains unpublished.
Jul 2013
Linne Mining engaged as contract miner SEC Form 8-K, 5 July 2013. Approximately USD 5.8 million advanced.
Apr 2015
Cusiani RESMODEL forensic report Identifies drill-hole trace errors, collar coordinate errors, missing lithology, non-log-normal distribution, and P-P plot departure. Read the report (PDF) →
Jul 2015
Cusiani “Specter Reserves” report Documents the GGMT01430 transposition: silver values reported as gold in the block model. Read the report (PDF) →
Aug 2015
Cusiani “Two Data Sets” report 1,500 duplicate pairs: t-statistic 7.28, Z-statistic −7.30, 2.6× grade divergence between labs. Read the report (PDF) →
Sep 2015
Mego-Gold LLC bankruptcy proceedings begin Linne Mining subsequently files a USD 39 million creditor claim.
Nov 2015
Linne Mining walks away Citing falsified assays. Five months before the 1 April 2016 GKZ reporting date.
1 Apr 2016
Reporting date of the Mego-Gold reserves submission None of the five adverse findings above is included in the submission.
4 Nov 2016
GKZ Expertise Conclusion N6 issued Reserves of 2.57 Mt at 5.00 g/t Au (Southern area) registered. Vote: 8-0-1 abstention. Point 6 of the conclusion requests that the Subsoil State Inspection perform a “credibility survey” of the operator’s data — simultaneously with the approval. Read the conclusion (PDF) →
4 Dec 2017
Global Gold Corp. transfers assets to officers, ceases SEC reporting 251-to-1 reverse share consolidation. Public record: USD 20.9 million liabilities, USD 40,591 cash.
Mar 2018
Project confirmed bankrupt at PDAC, Toronto Armenian government representatives confirm status on record.
2026
Optima Management Company named as exclusive operator Invited to rely on the 2016 GKZ reserves register.
§ 10  ·  The record

Primary documents

The documents below are hosted on this site. Where appropriate, supporting SEC filings are linked directly to EDGAR. The complete document register is maintained at krikorian-fraud-toukhmanuk.netlify.app.

Technical briefing · 2026
Toukhmanuk 2016 GKZ Reserves — Technical Briefing for Optima Management
PDF · the full analysis underlying this site
Primary source · 2016
GKZ State Subsoil Expertise Conclusion N6
PDF · Armenian original, translated · 4 November 2016
NI 43-101 · 2011
Behre Dolbear Independent Technical Report — Toukhmanuk & Getik
PDF · QP Christopher J.V. Wheatley · 17 October 2011
Forensic report · 2015
Behre Dolbear Reports Specter Reserves
PDF · Cusiani / Geo-Logaritmica · 15 July 2015 · GGMT01430
Forensic report · 2015
What Is Wrong With RESMODEL Block Models
PDF · Cusiani · 30 April 2015 · drill hole errors
Statistical report · 2015
Two Data Sets — Comparison of Resources
PDF · Cusiani · 4 August 2015 · 1,500-pair duplicate analysis
Executed contract · 2011
CSA Global Assignment Specification Agreement — RAS.TRK.01
PDF · 7 pages · signed 18 Nov 2011 by Van Z. Krikorian (Chairman) and 20 Oct 2011 by Malcolm Titley (MD, CSA Global)
Source report · 2012
CSA Global Correlation Report — Executive Summary
DOCX · CSA Global · 20 April 2012 · the programme's Executive Summary
Source data · 2012
CSA Paired Spreadsheet — ALS pulps vs. Global Gold database
XLSX · 551 paired gold and silver assays · the 17.3× divergence dataset
Source data · 2012
CSA Paired Spreadsheet — ALS pulps vs. ALS core re-assays
XLSX · 505 paired assays · control: internal CSA methodology consistent
SEC filing · 2011
Form 8-K — CRA joint-venture agreement
EDGAR · Global Gold Corp. · 17 March 2011
SEC filing · 2013
Form 8-K — Linne Mining agreement
EDGAR · Global Gold Corp. · 5 July 2013
External · Ongoing
Krikorian · GBGD fraud record
Complete document archive maintained by Bill Mavridis
§ 11  ·  Addressed to

Optima Management Company

The briefing underlying this site is delivered to Optima Management Company as the current operator of the Toukhmanuk gold mine. It is made public because the 2016 state register is public, and because each counterparty relying on it is entitled to the same facts.

Delivered to

Optima Management Company
Exclusive Operator, Toukhmanuk
116 Nalbandyan St., Yerevan
Republic of Armenia
optimamanagmentcompany@gmail.com

Compiled by

Bill Mavridis
Former JV Partner of Global Gold Corp.
Montreal, Quebec, Canada
Tel / WhatsApp: +1 514-813-9200
vzk.exposed@gmail.com